Data-driven research
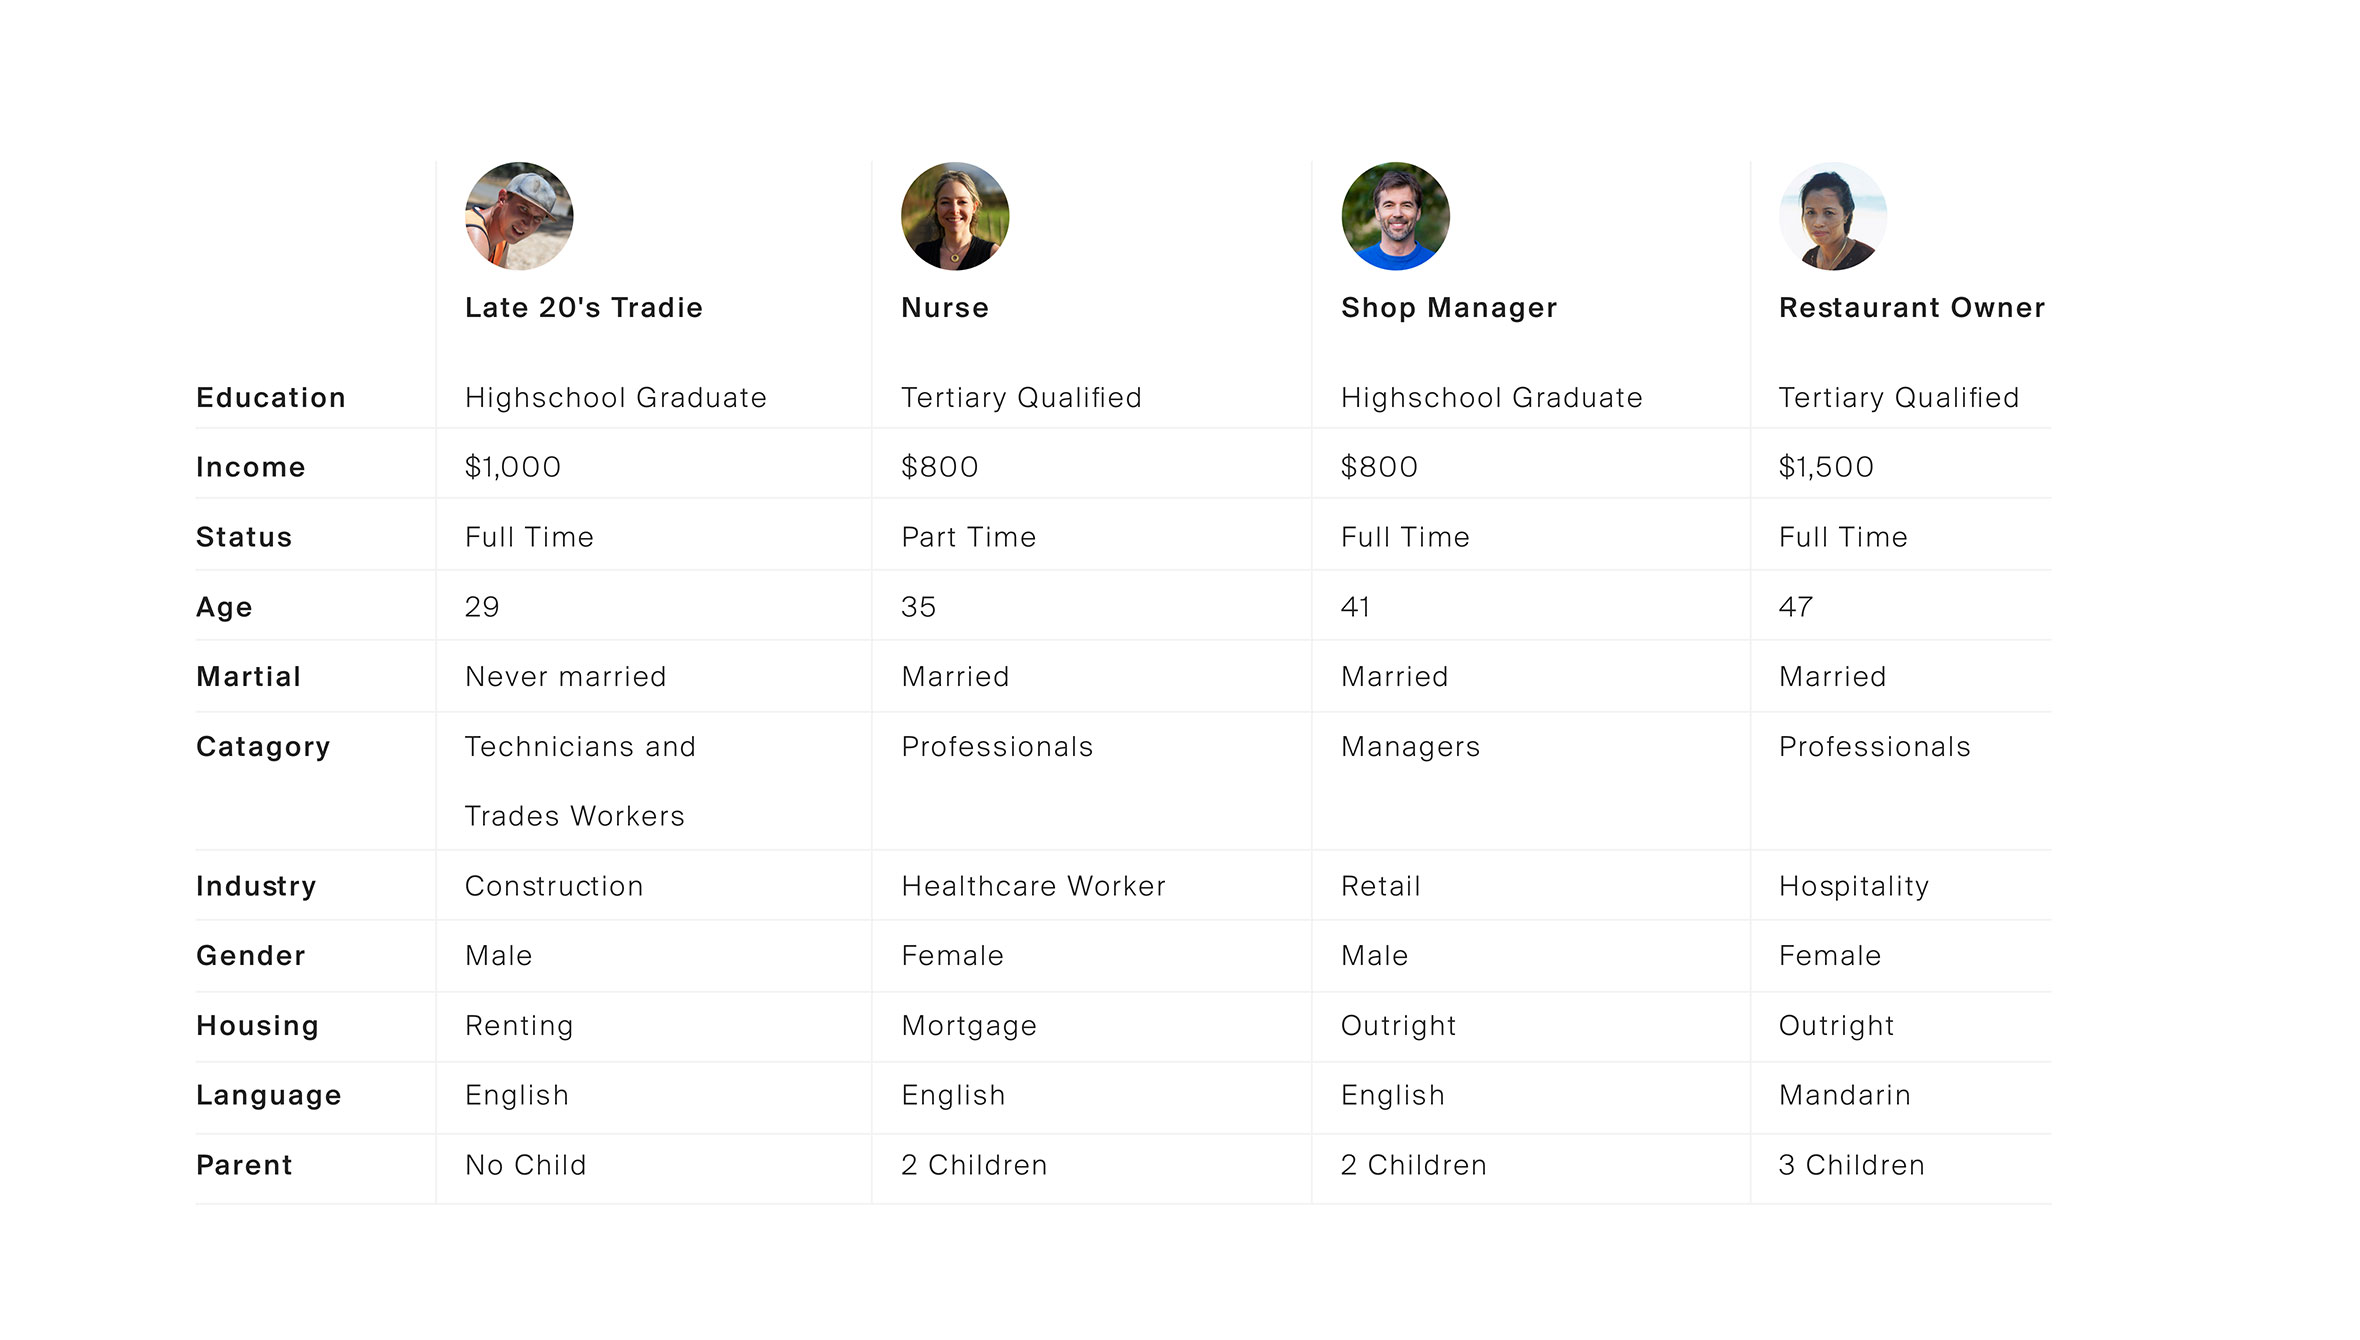
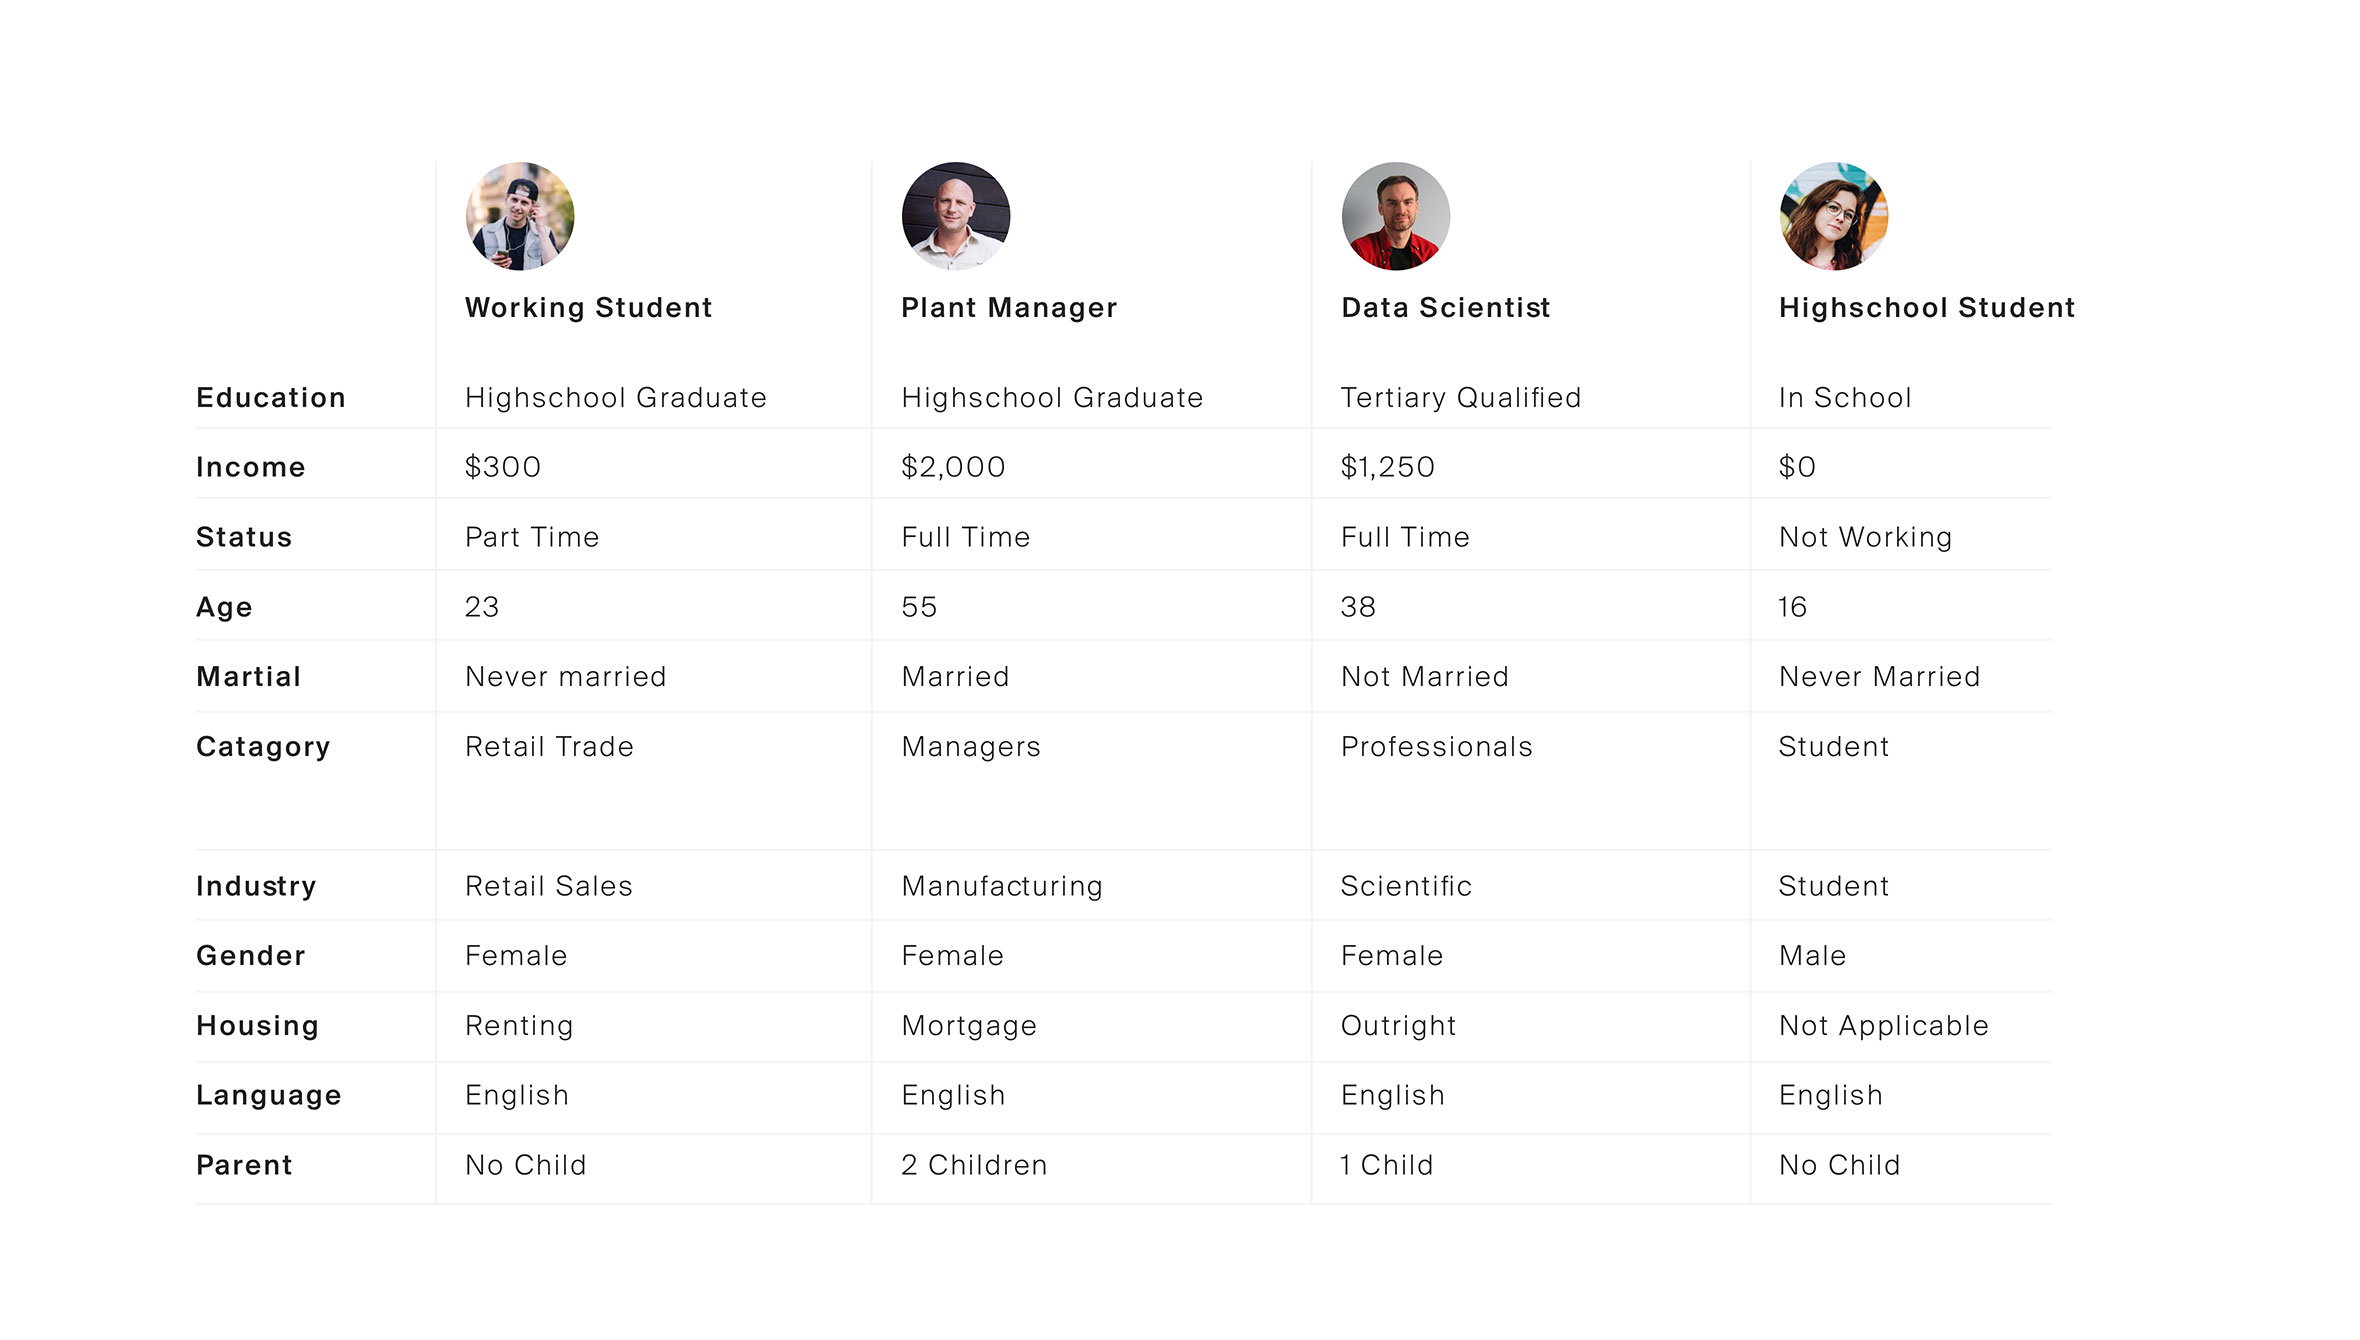
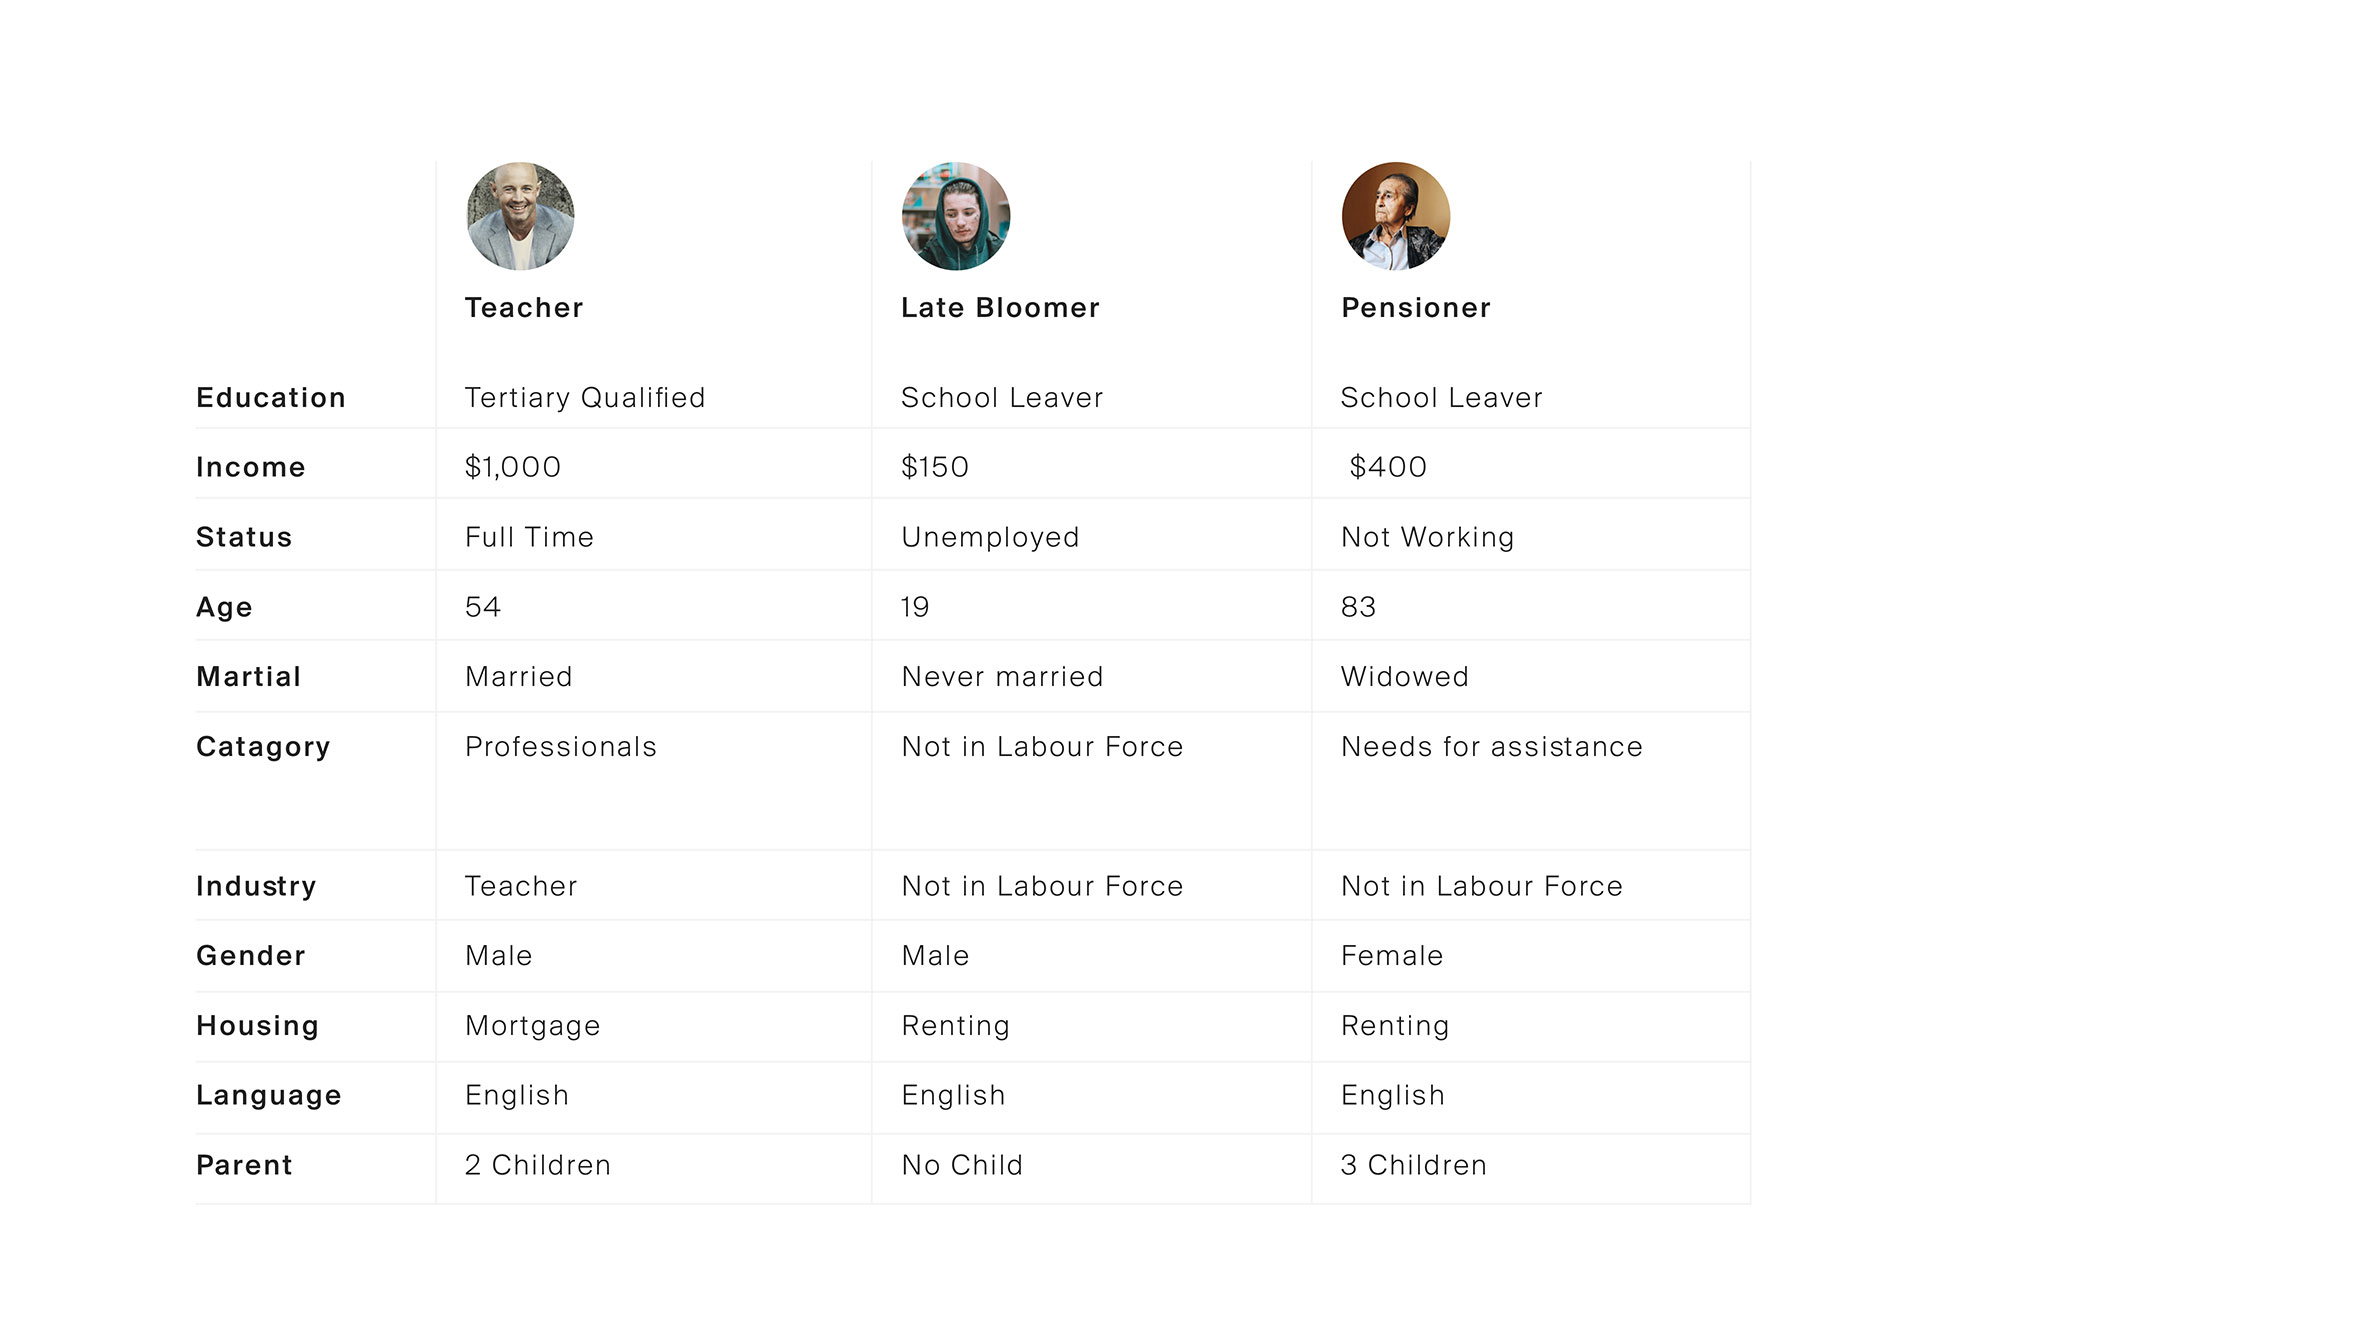
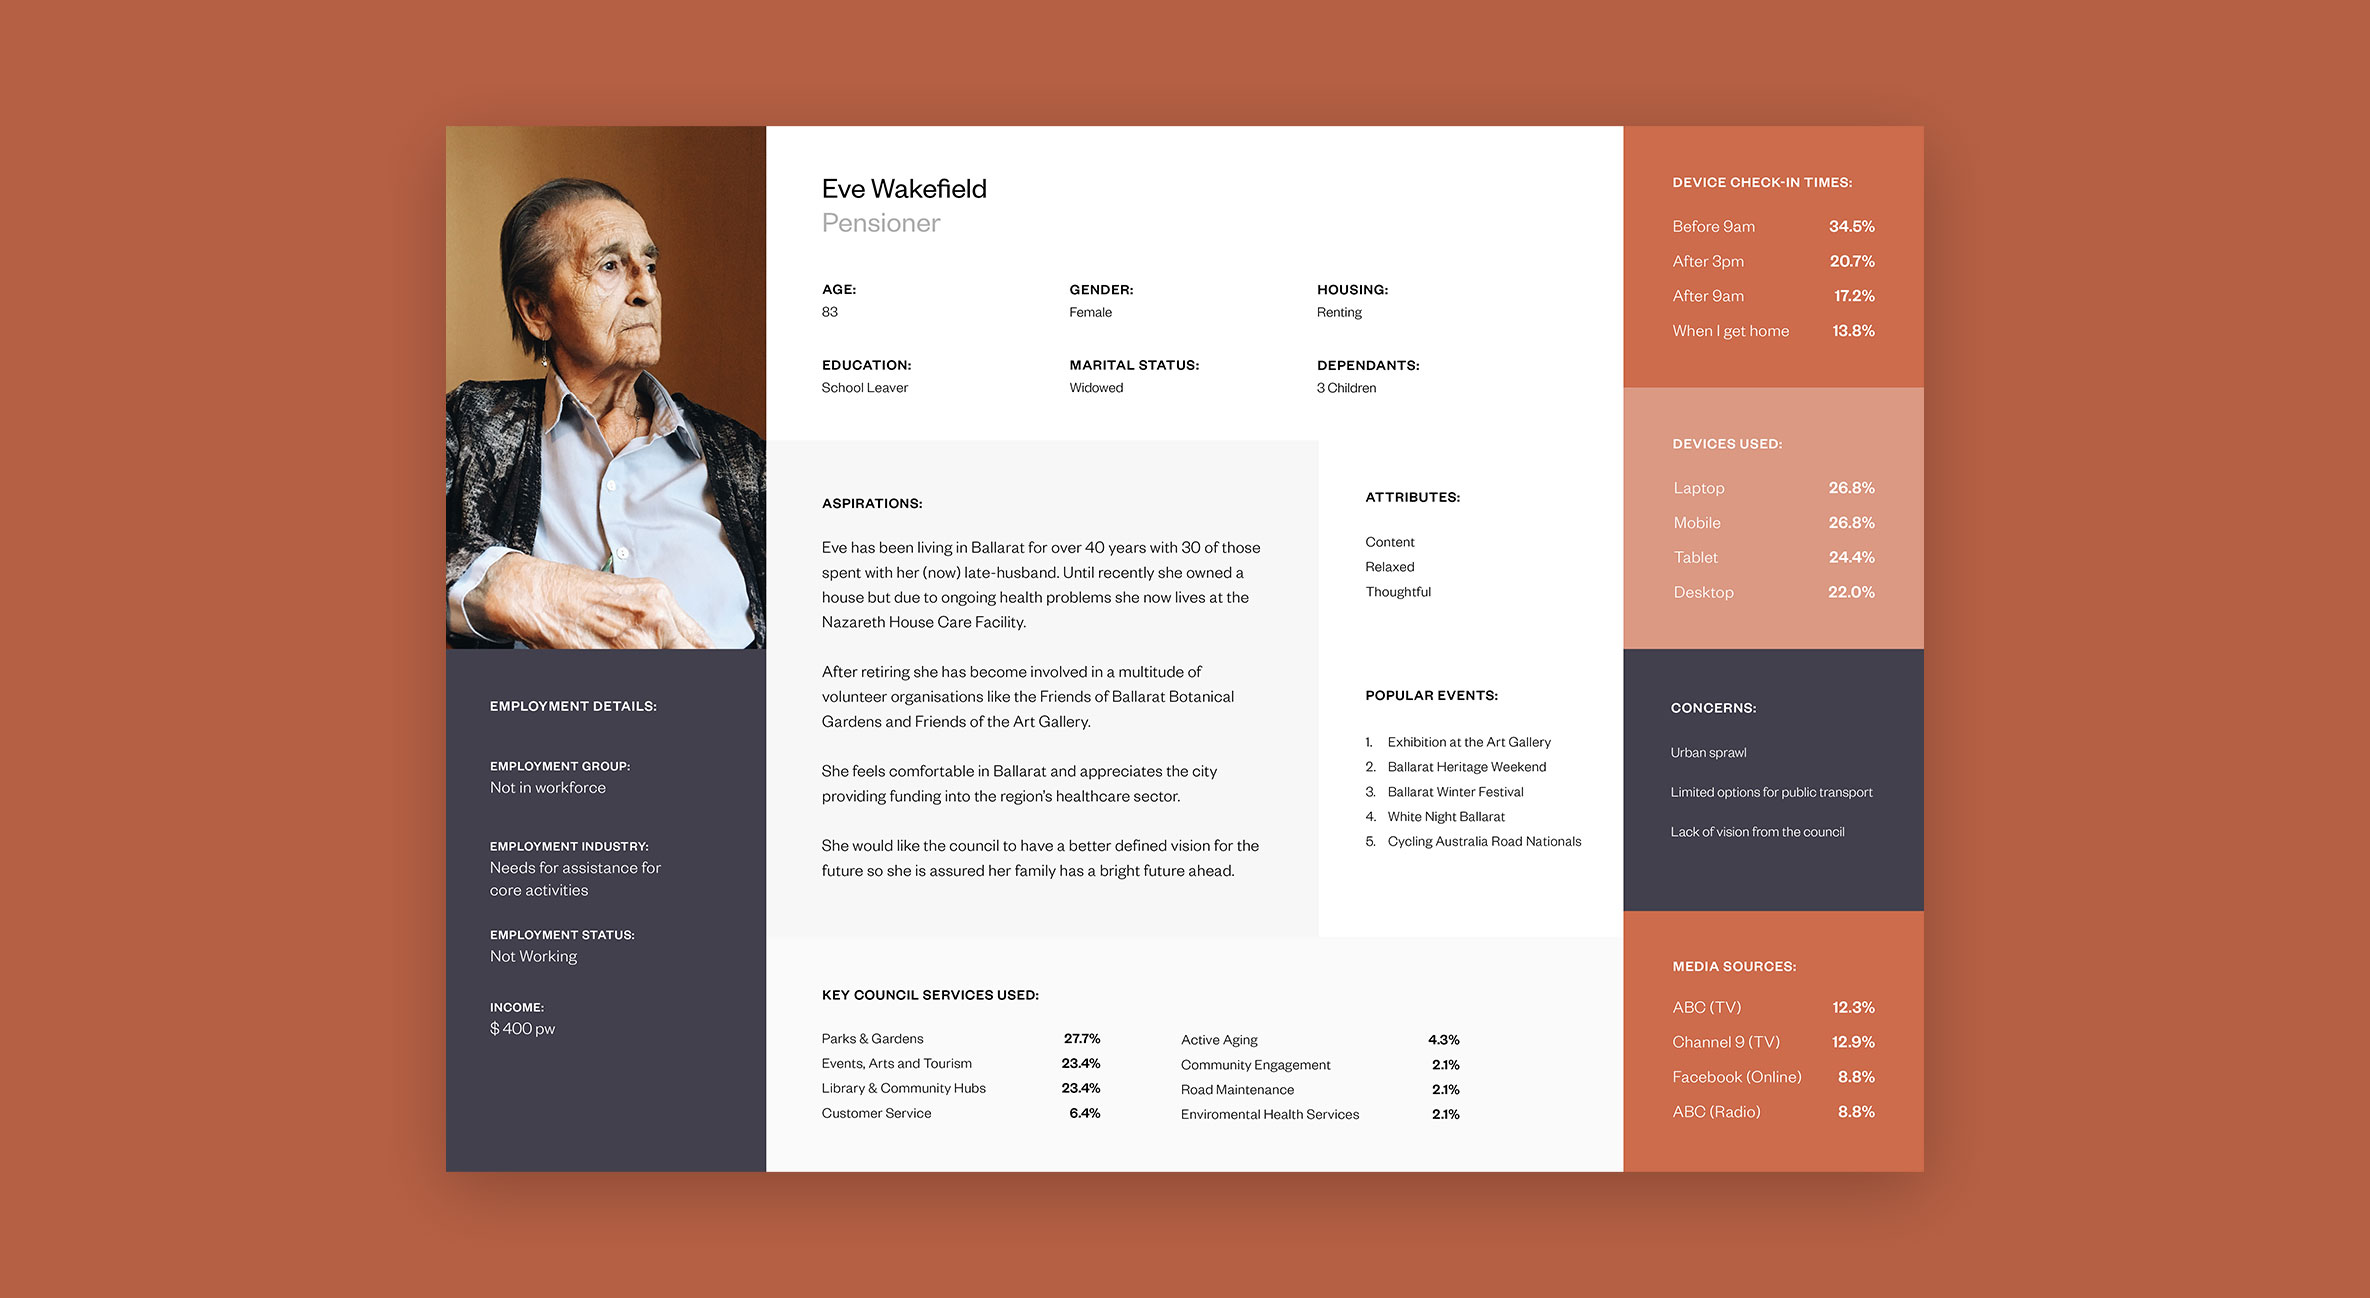
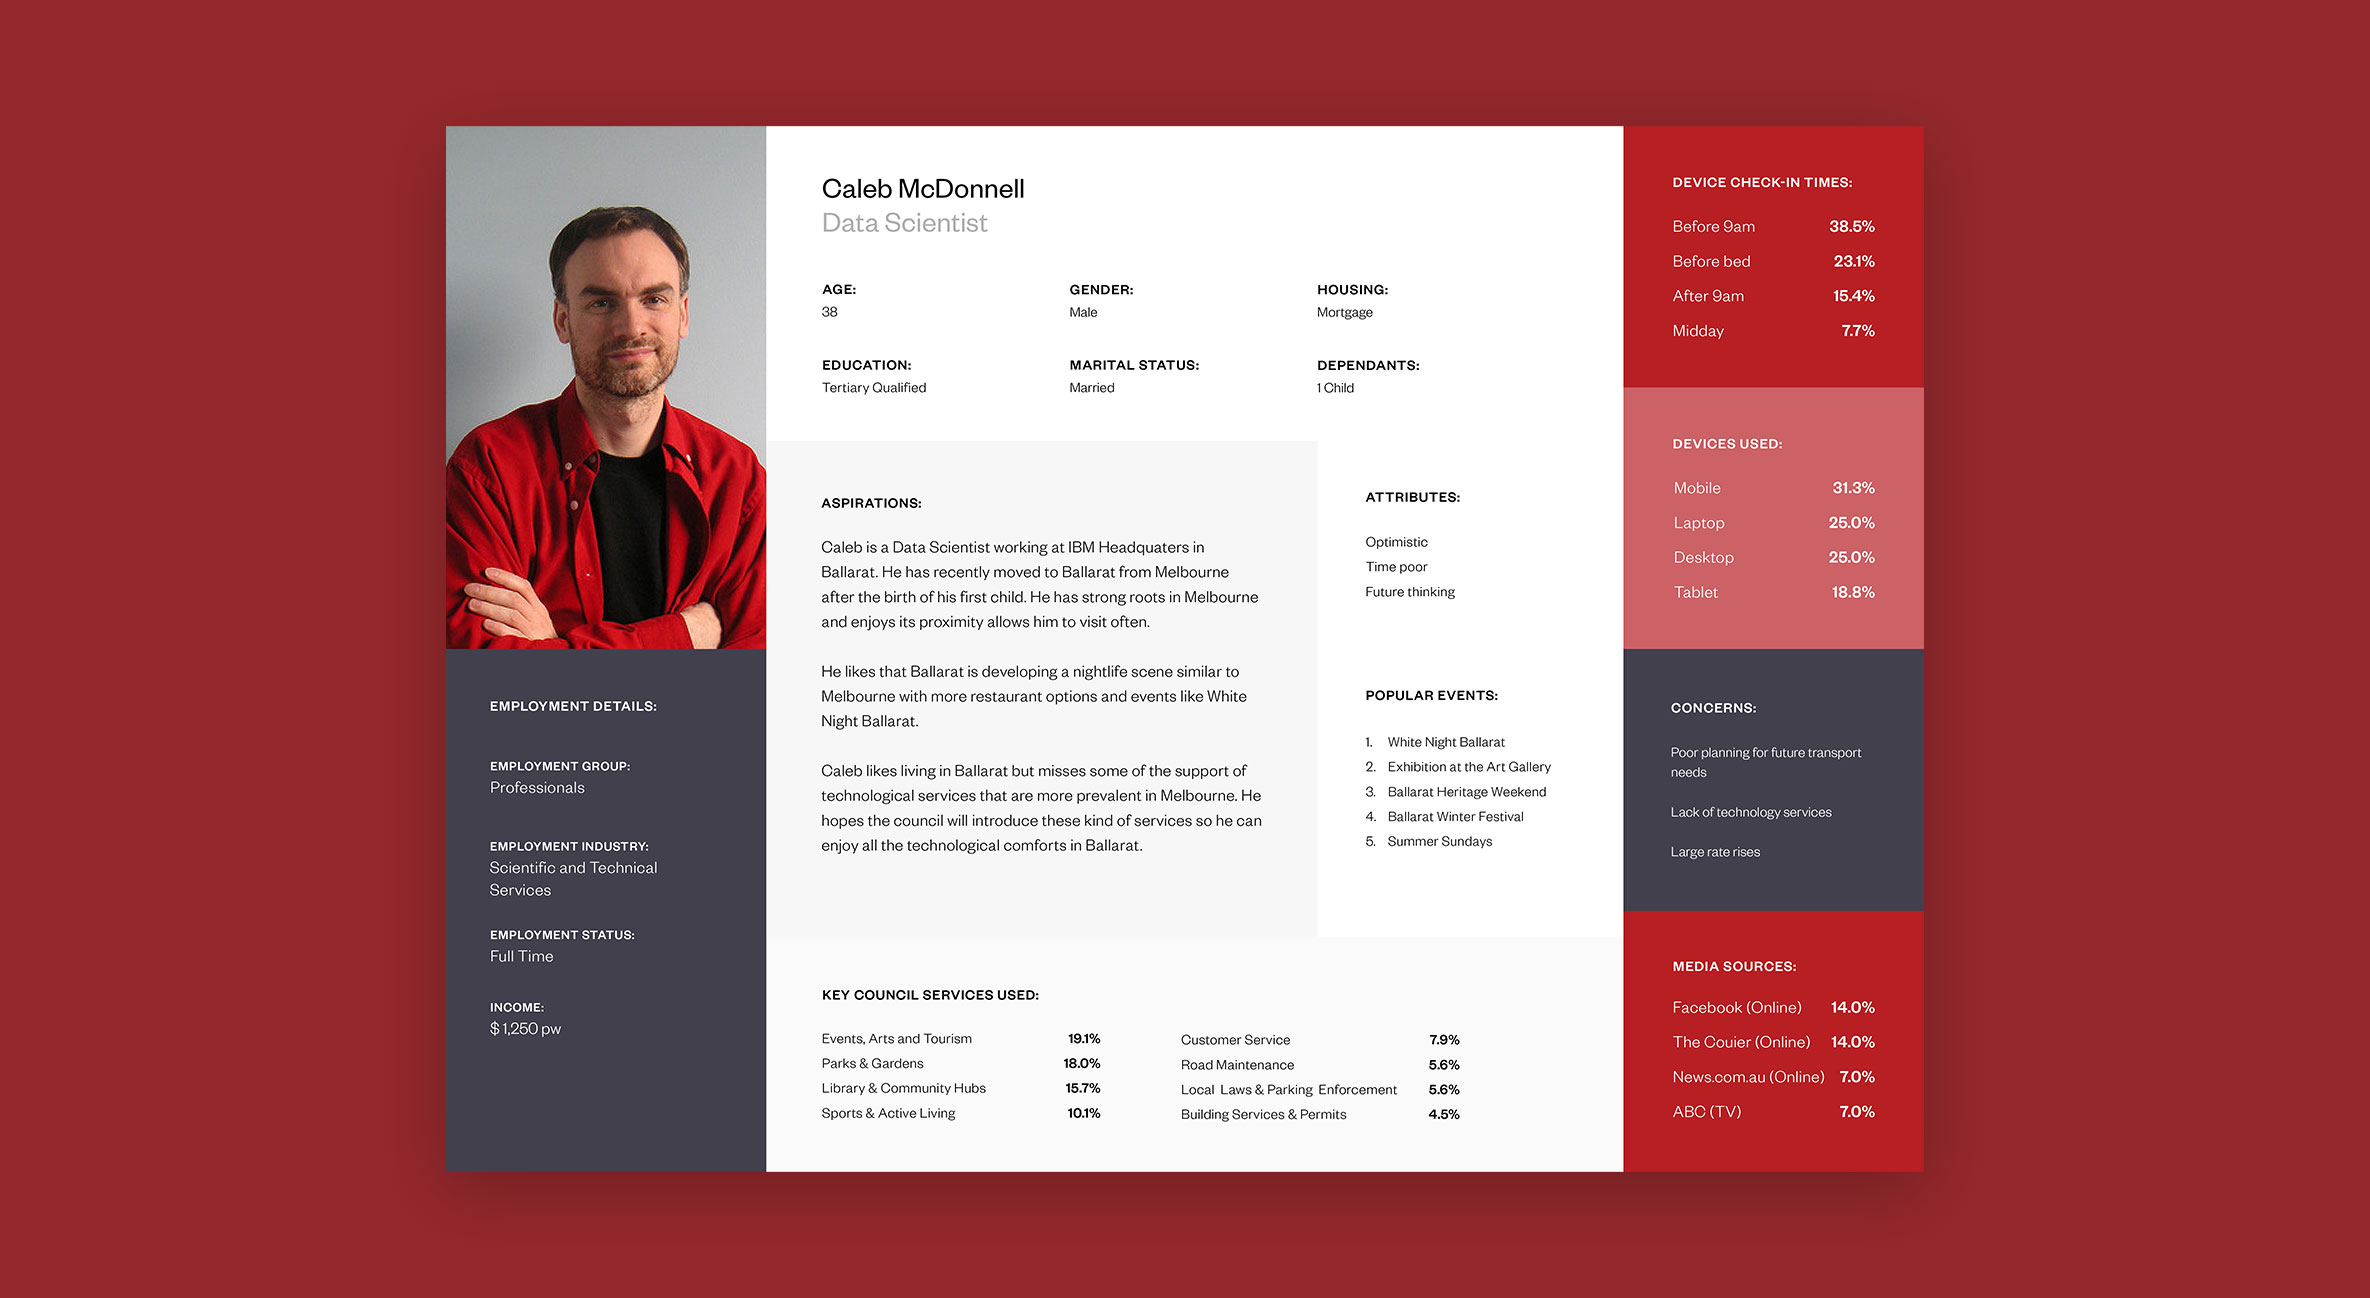
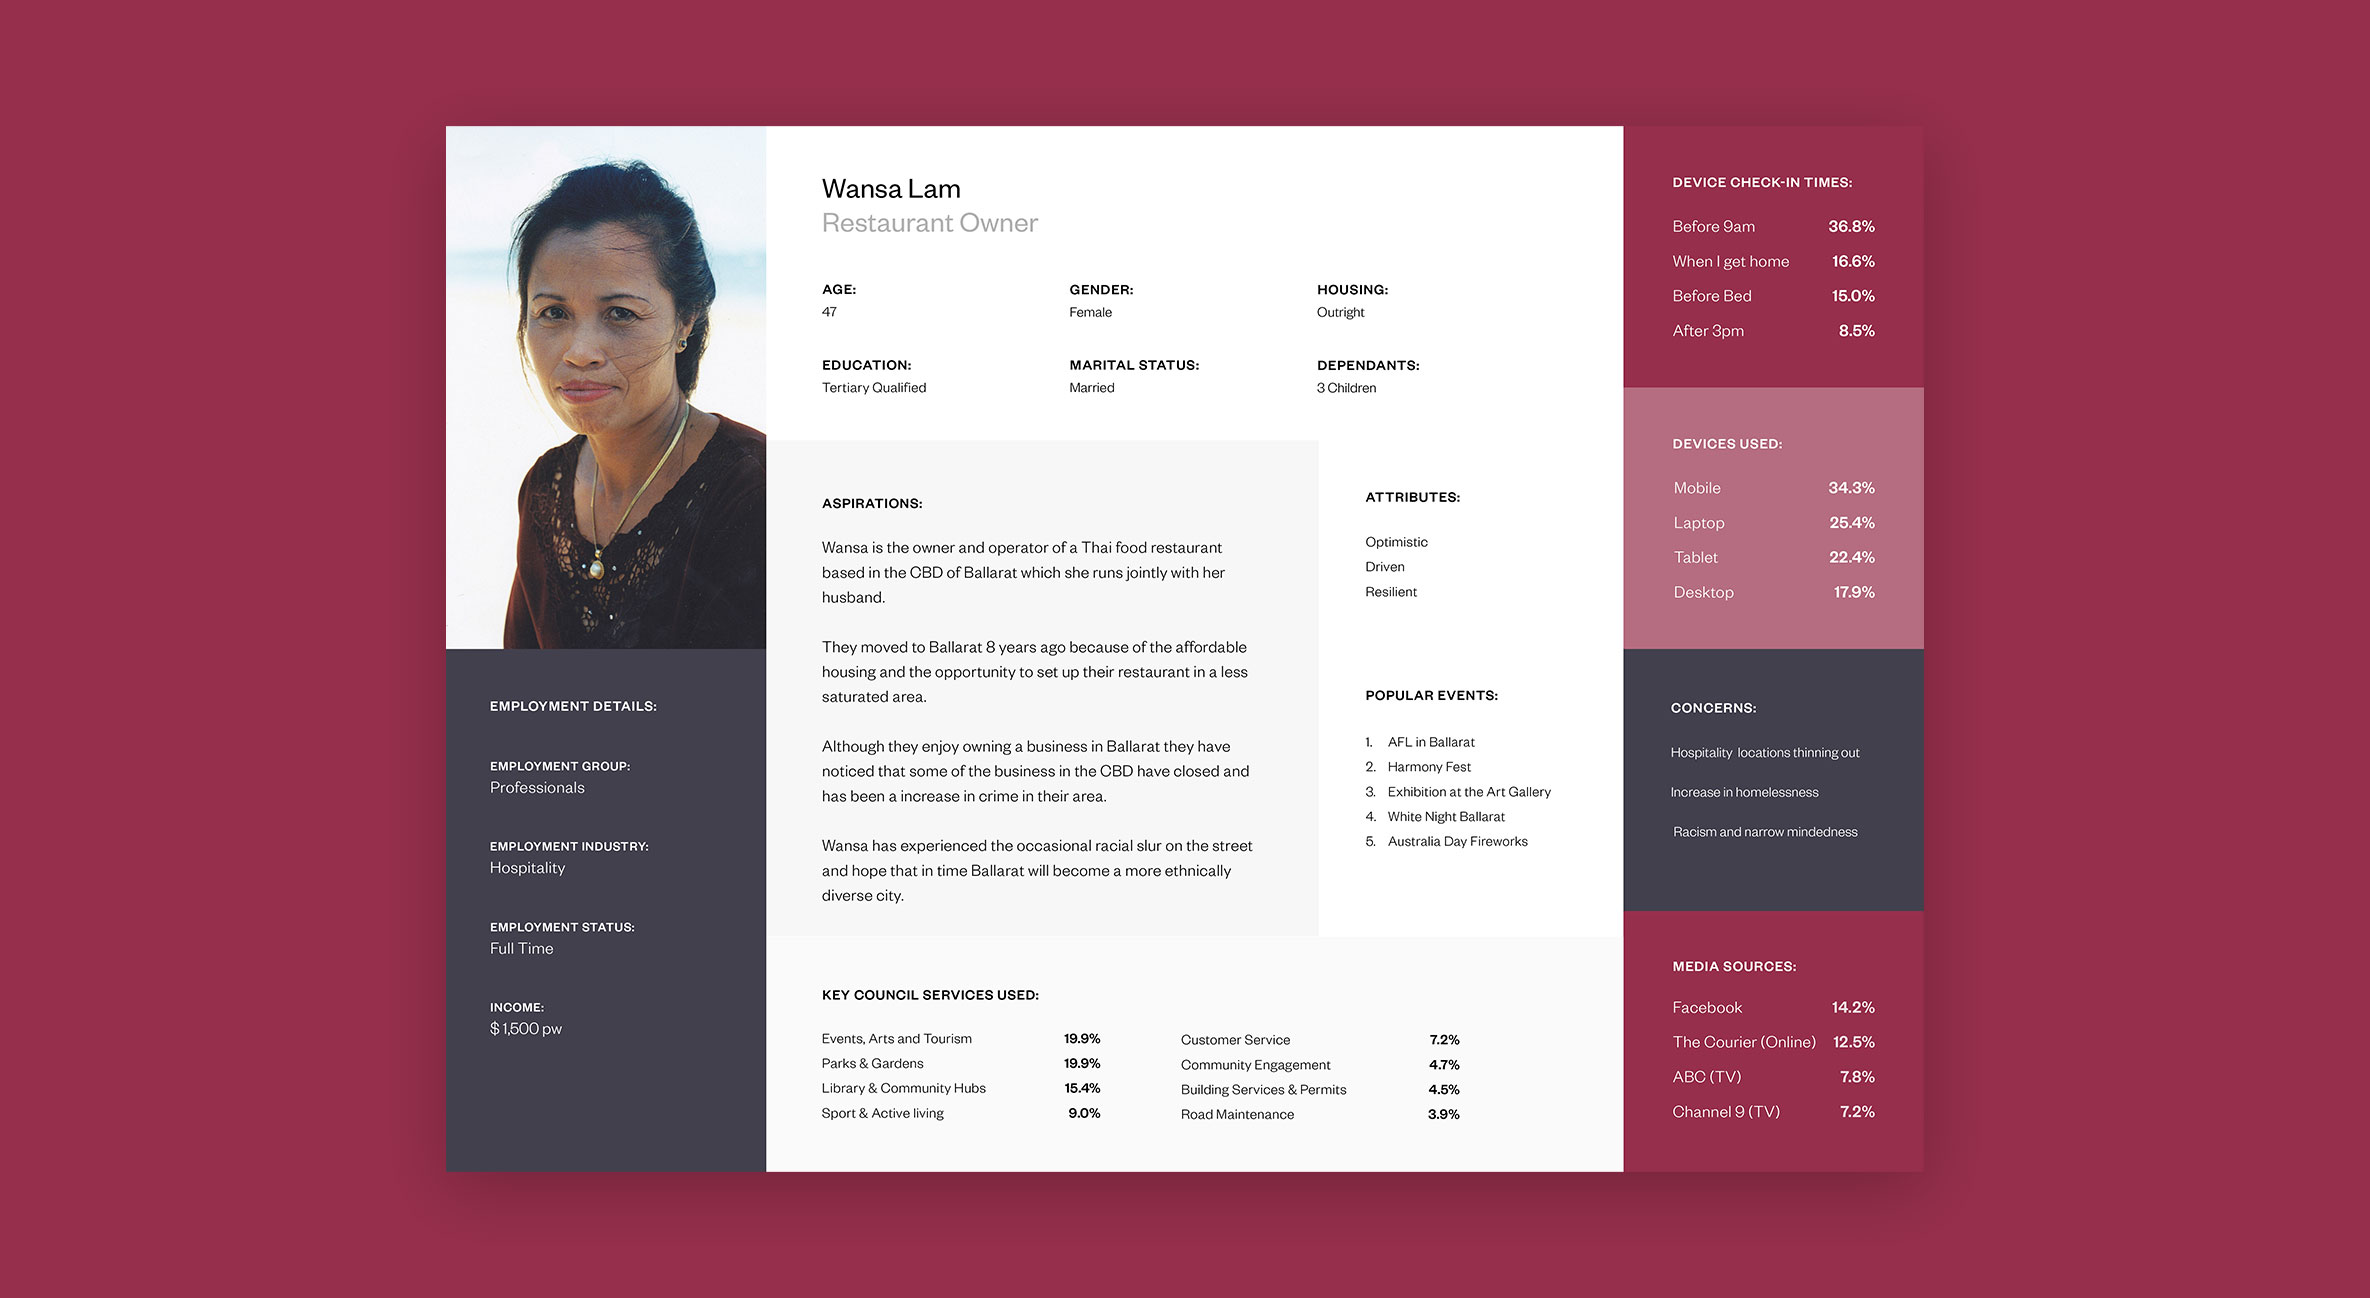
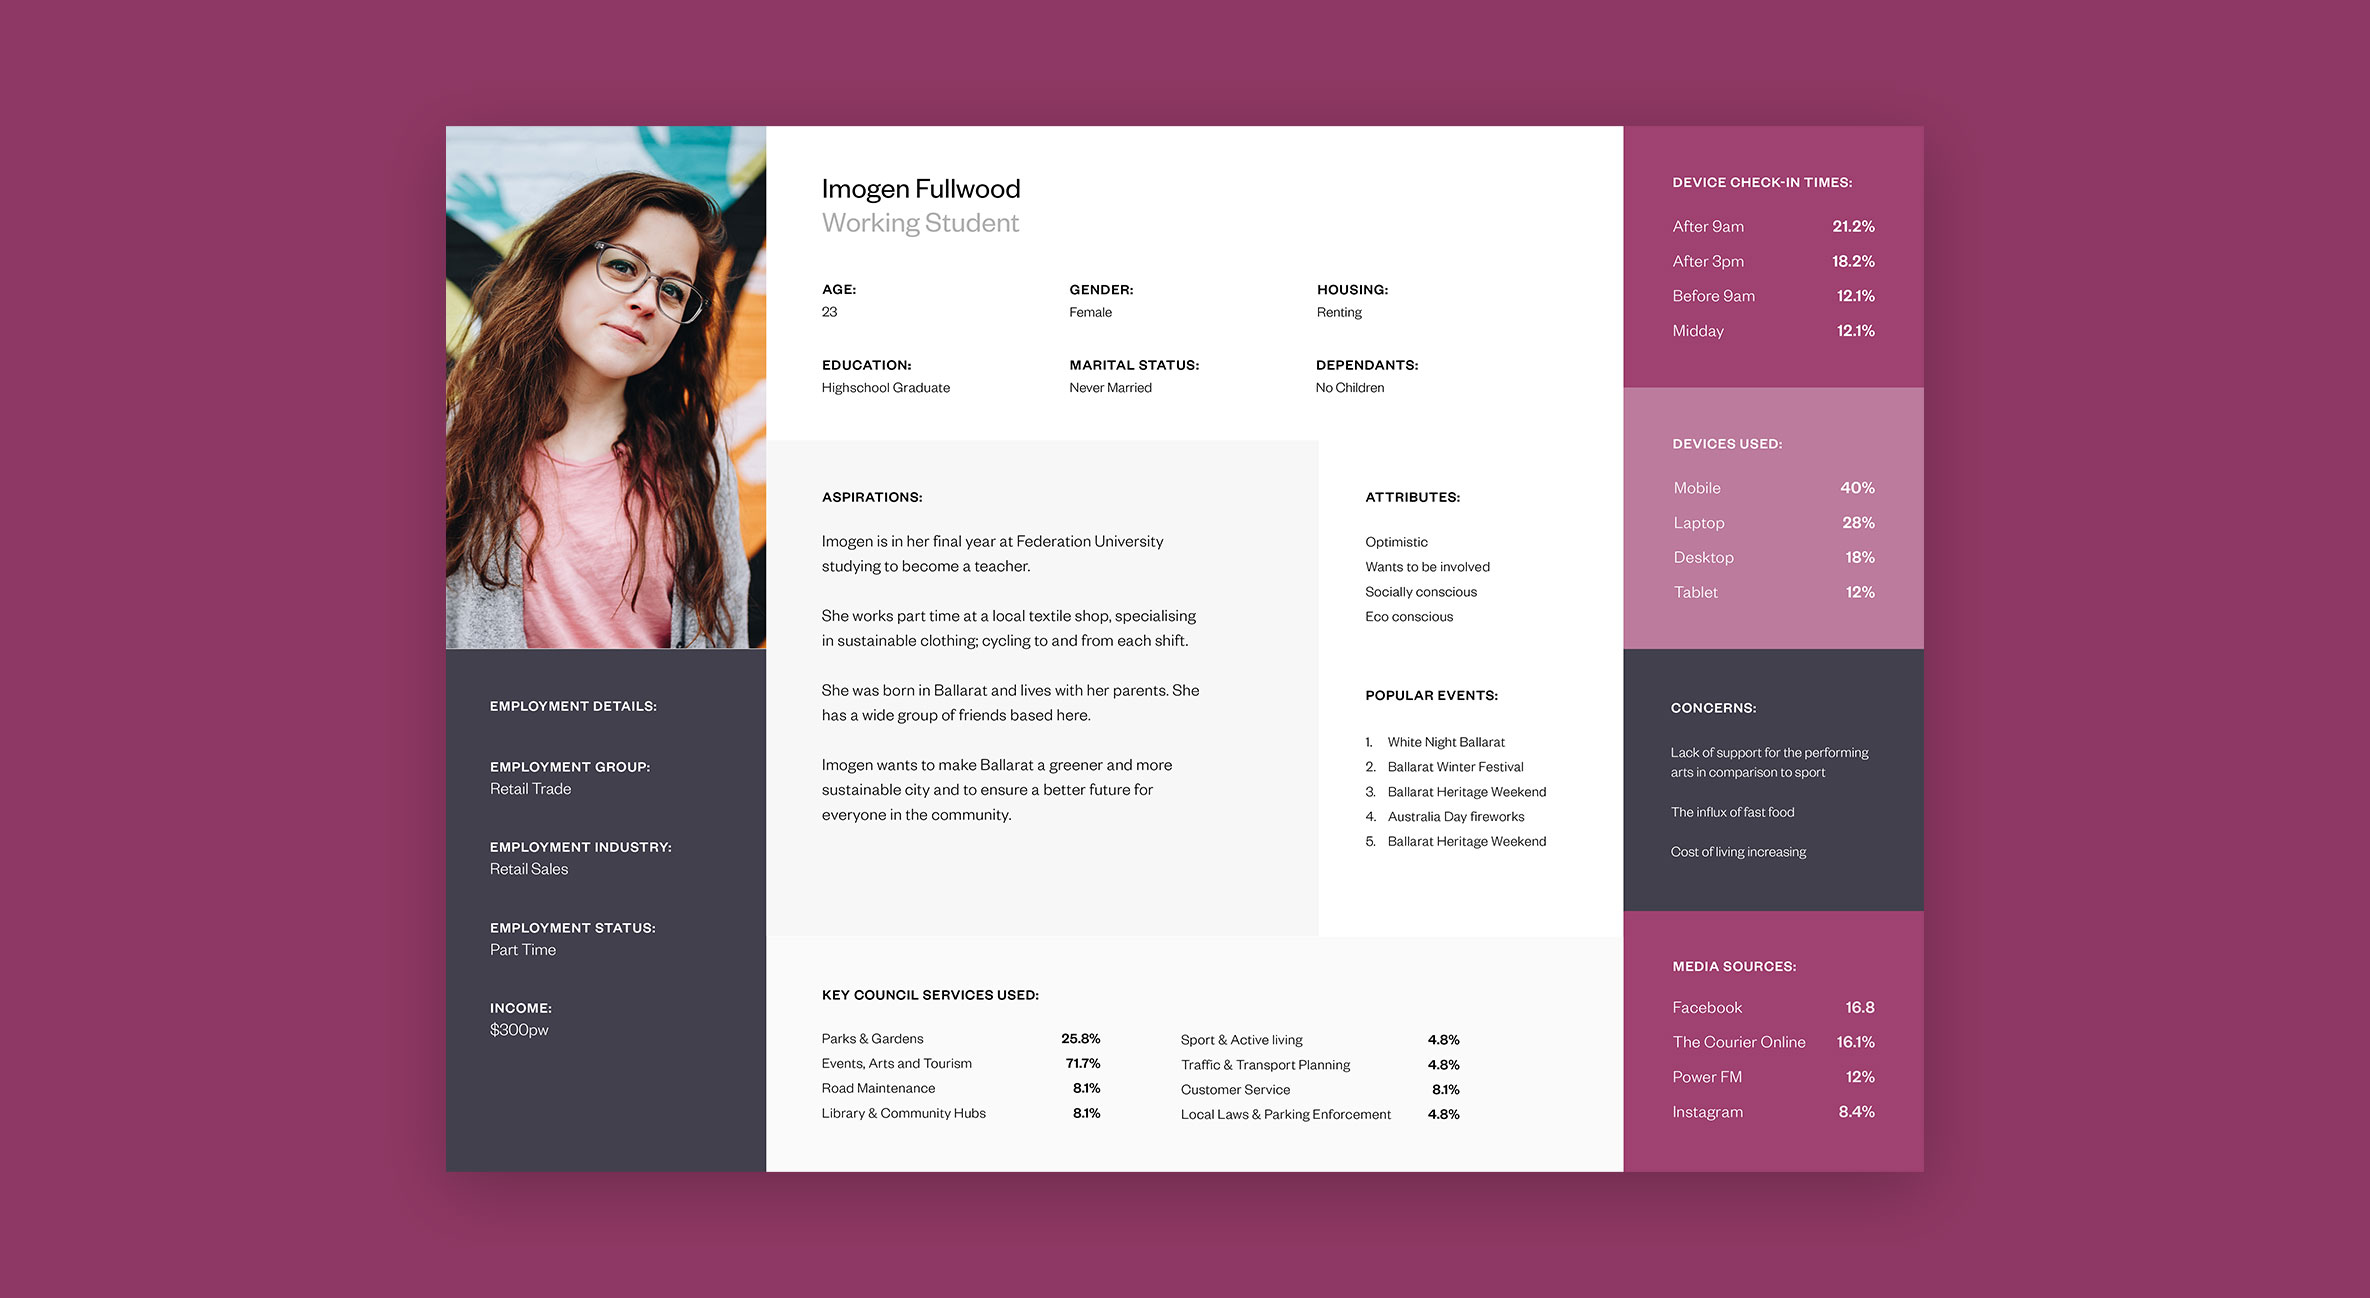
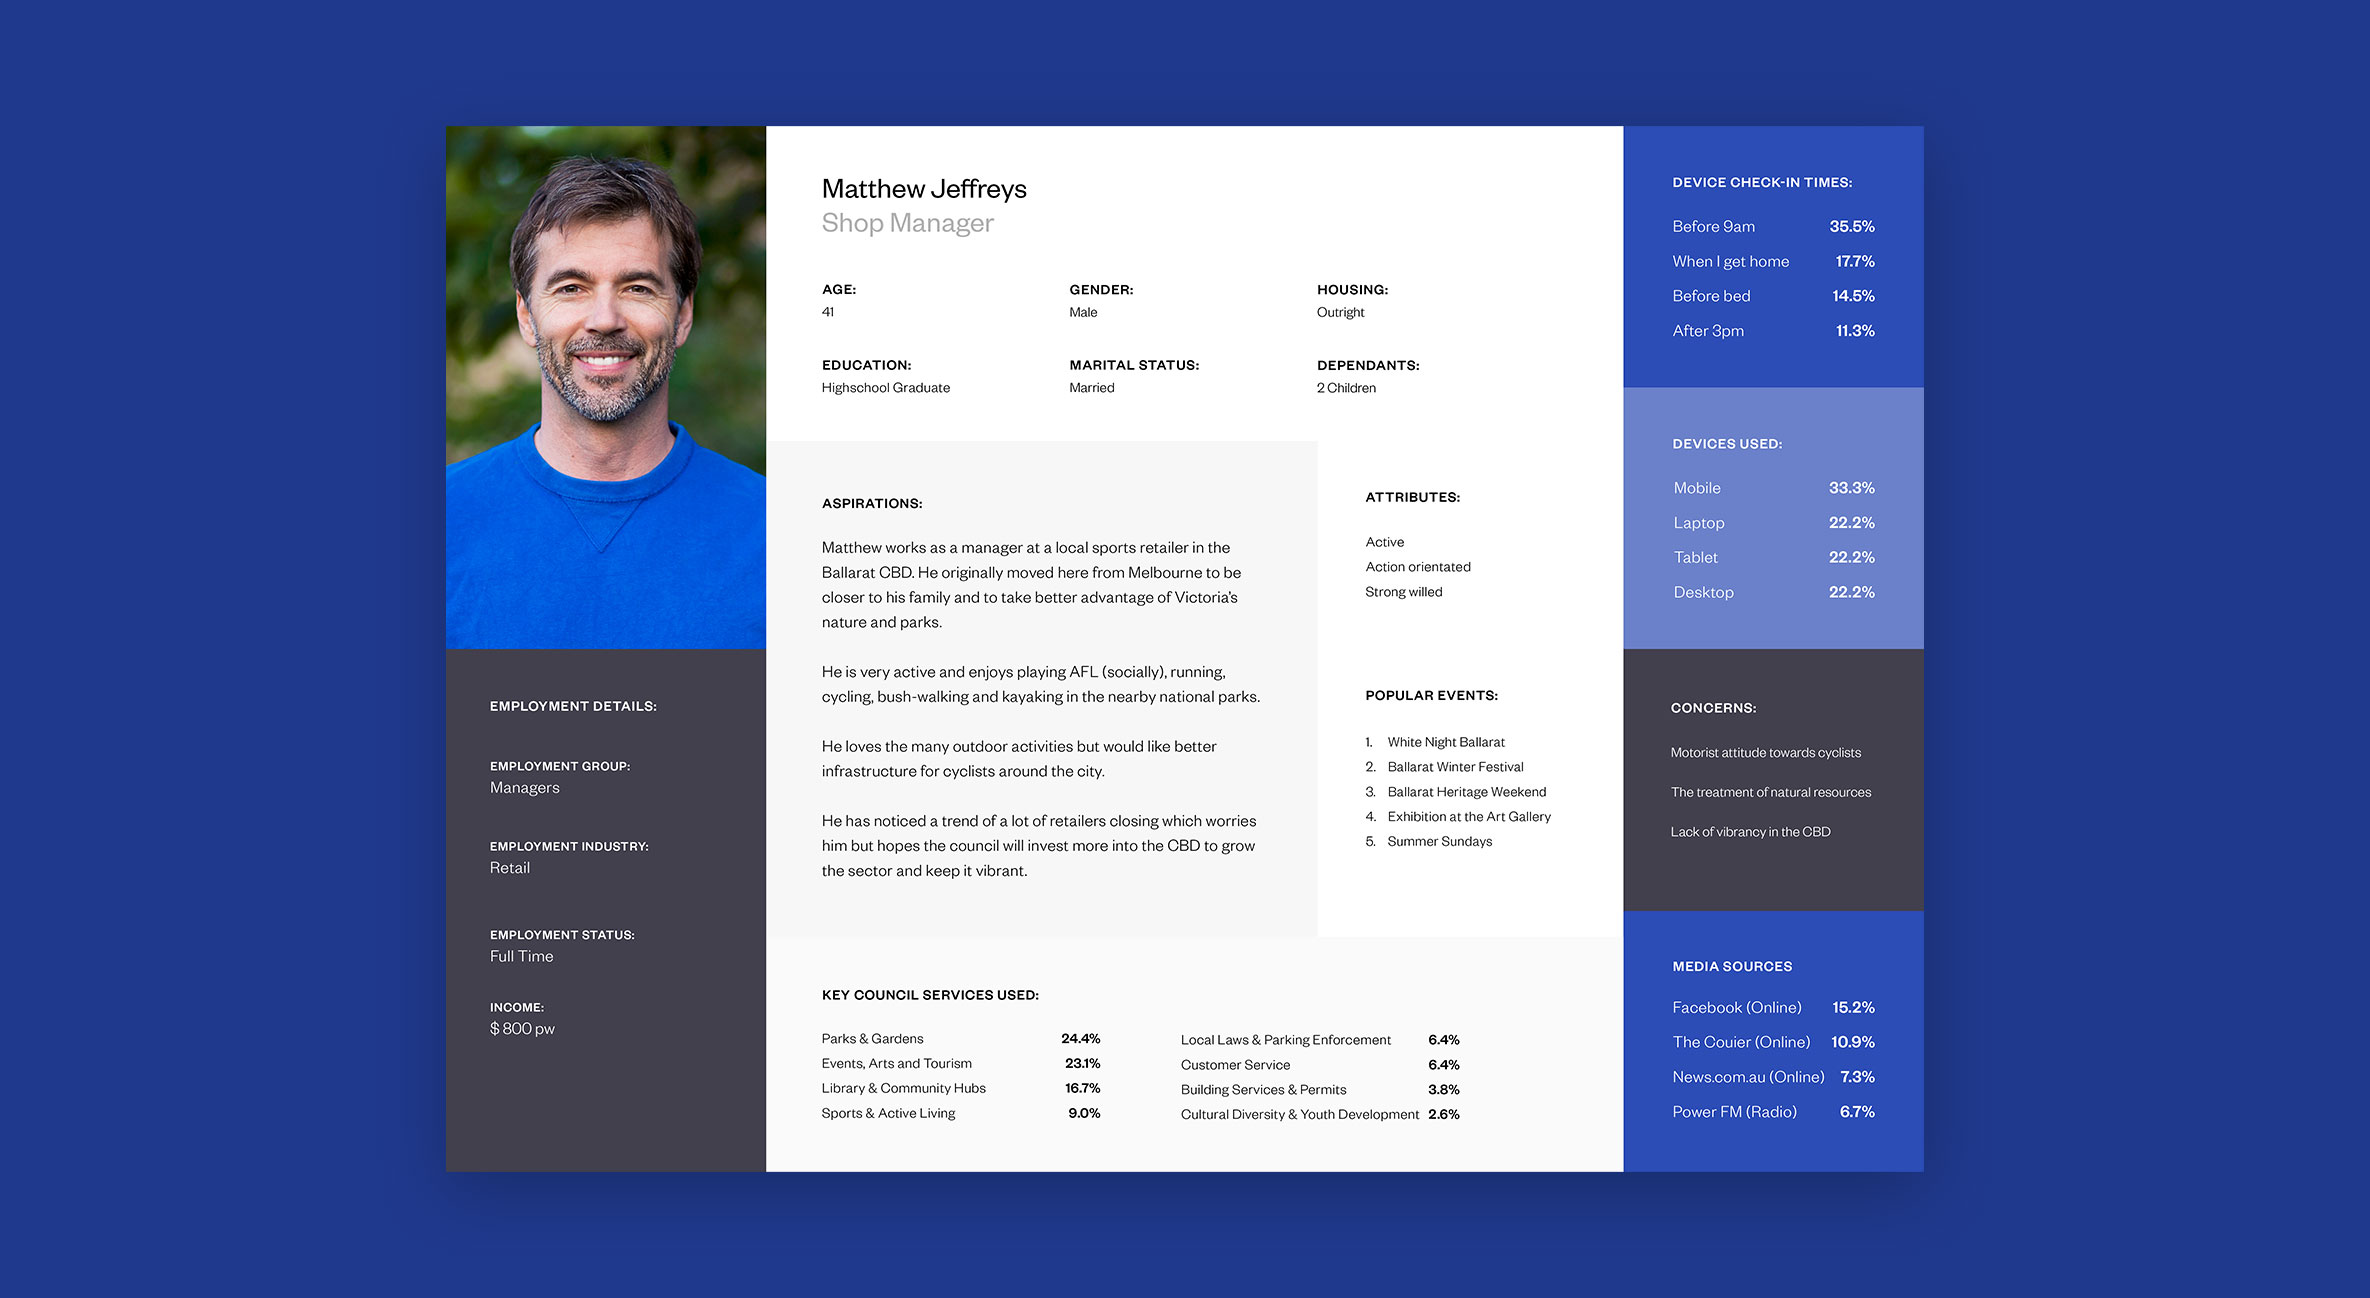
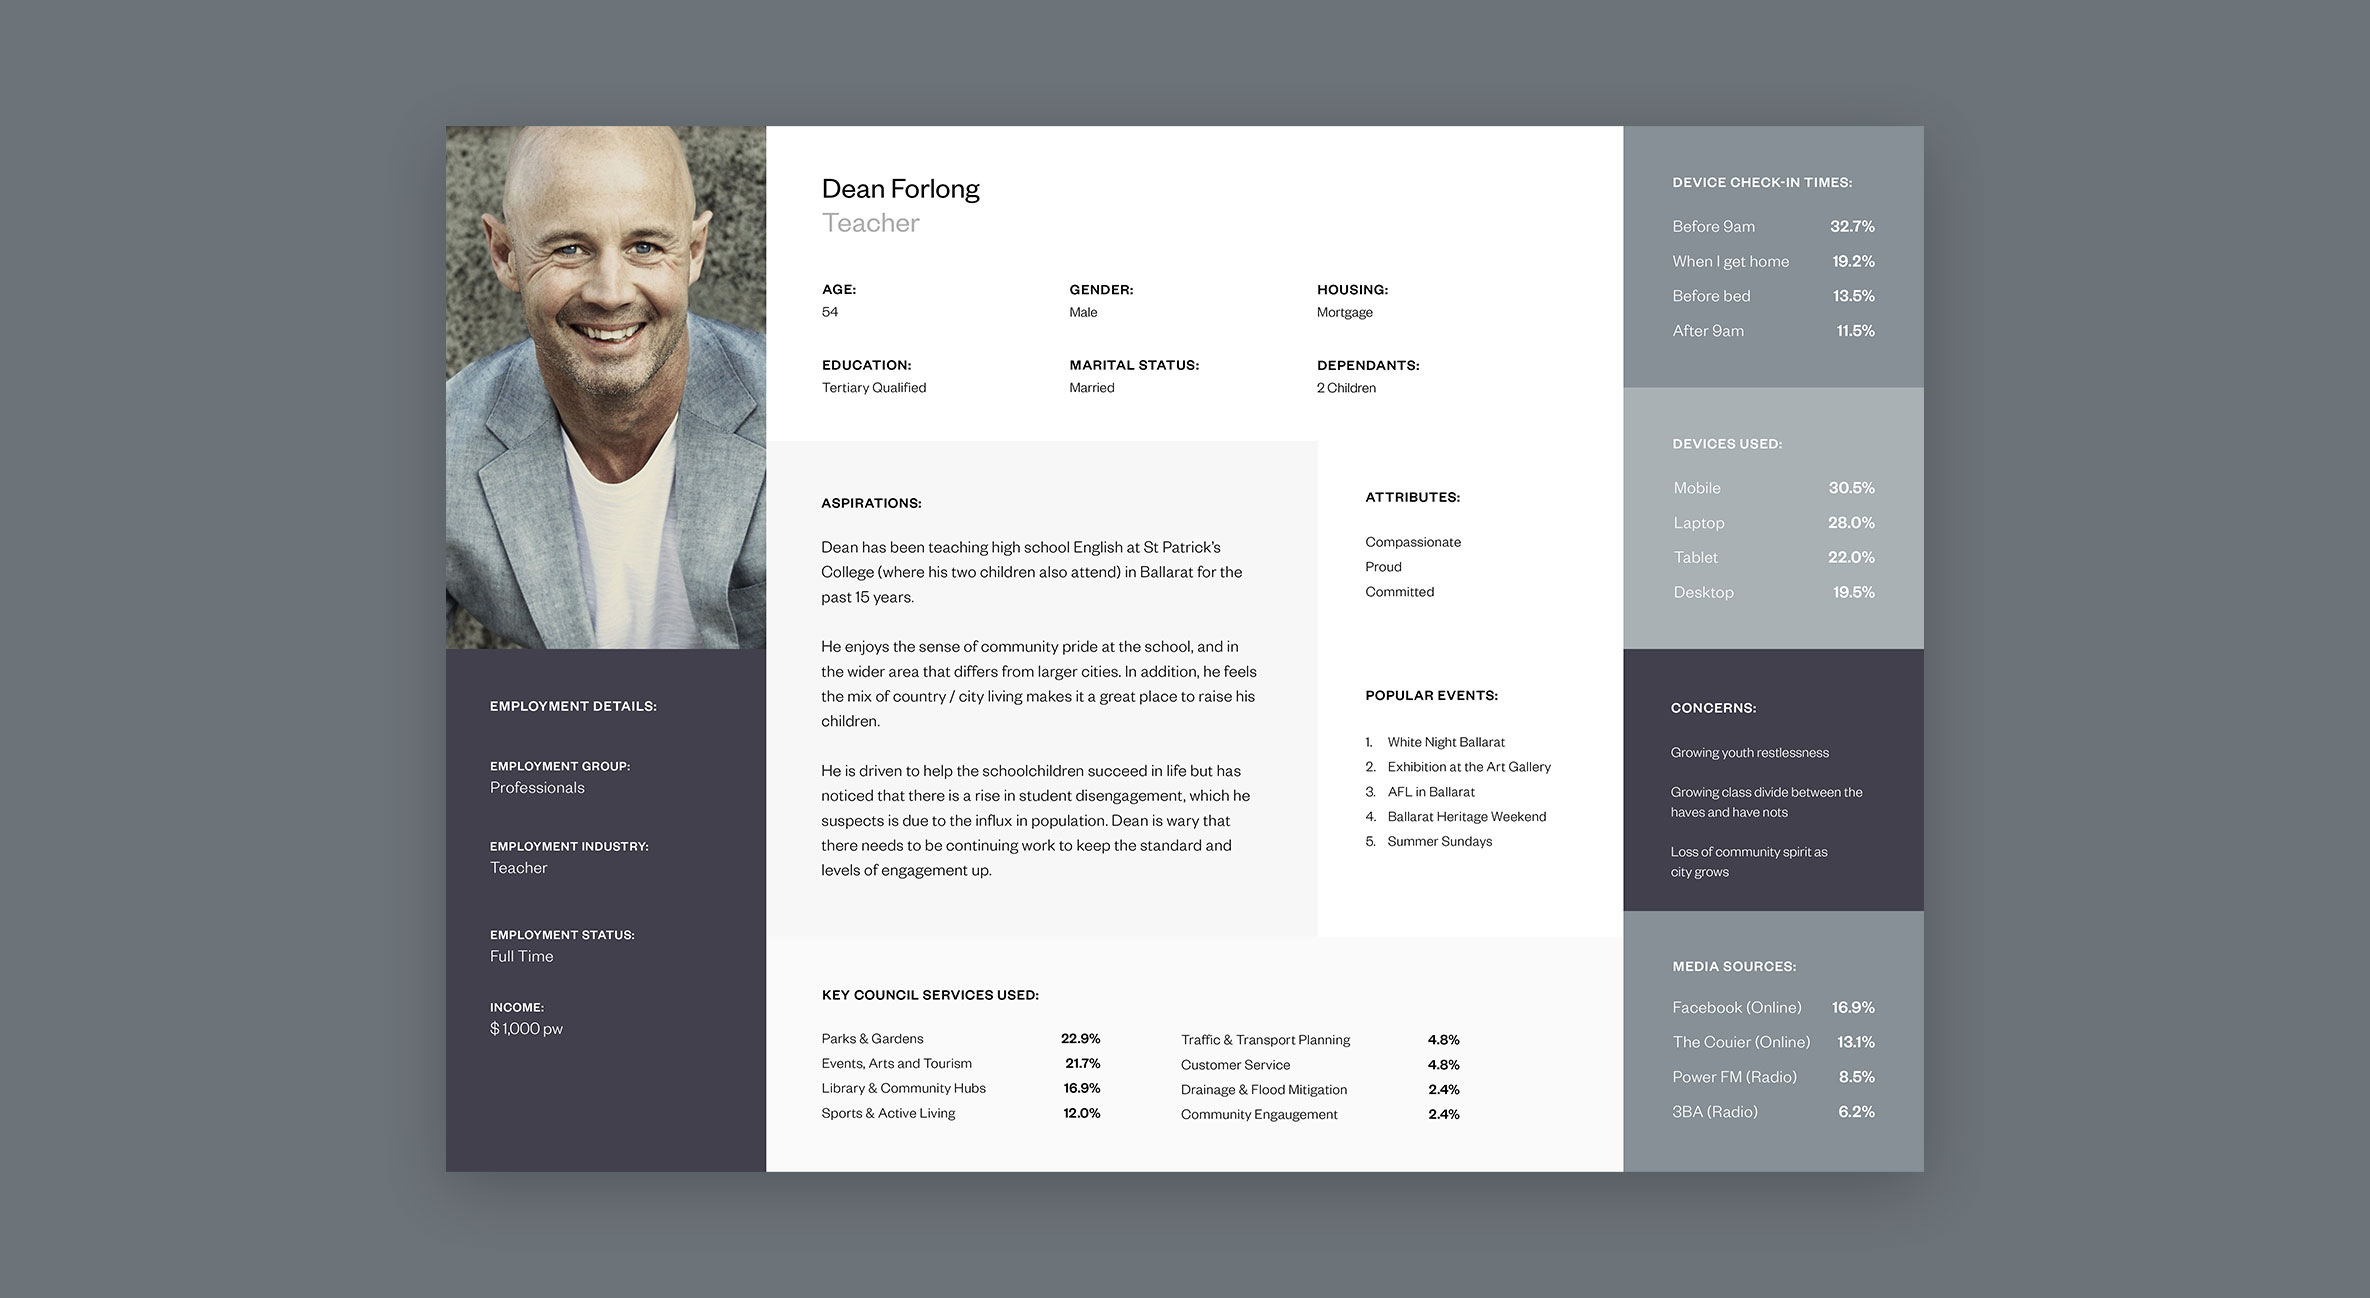
In order to understand the Ballarat community we first had to identify what a cross-section of the population looked like. Our solution was to look at the 2016 census data on Ballarat as a comprehensive starting point for our categorisations. Working with two data scientists, we used K-mode clustering algorithms to segment the population using the following data points:
- Education
- Income
- Status
- Age
- Marital
- Job category
- Industry
- Gender
- Housing
- Language
- Parent
The K-mode clustering converts the data into dimensions and attempts to find the centres of the regions of highest density. This means that we can find clusters that are large enough to be statistically relevant while also being different enough to warrant their own persona.
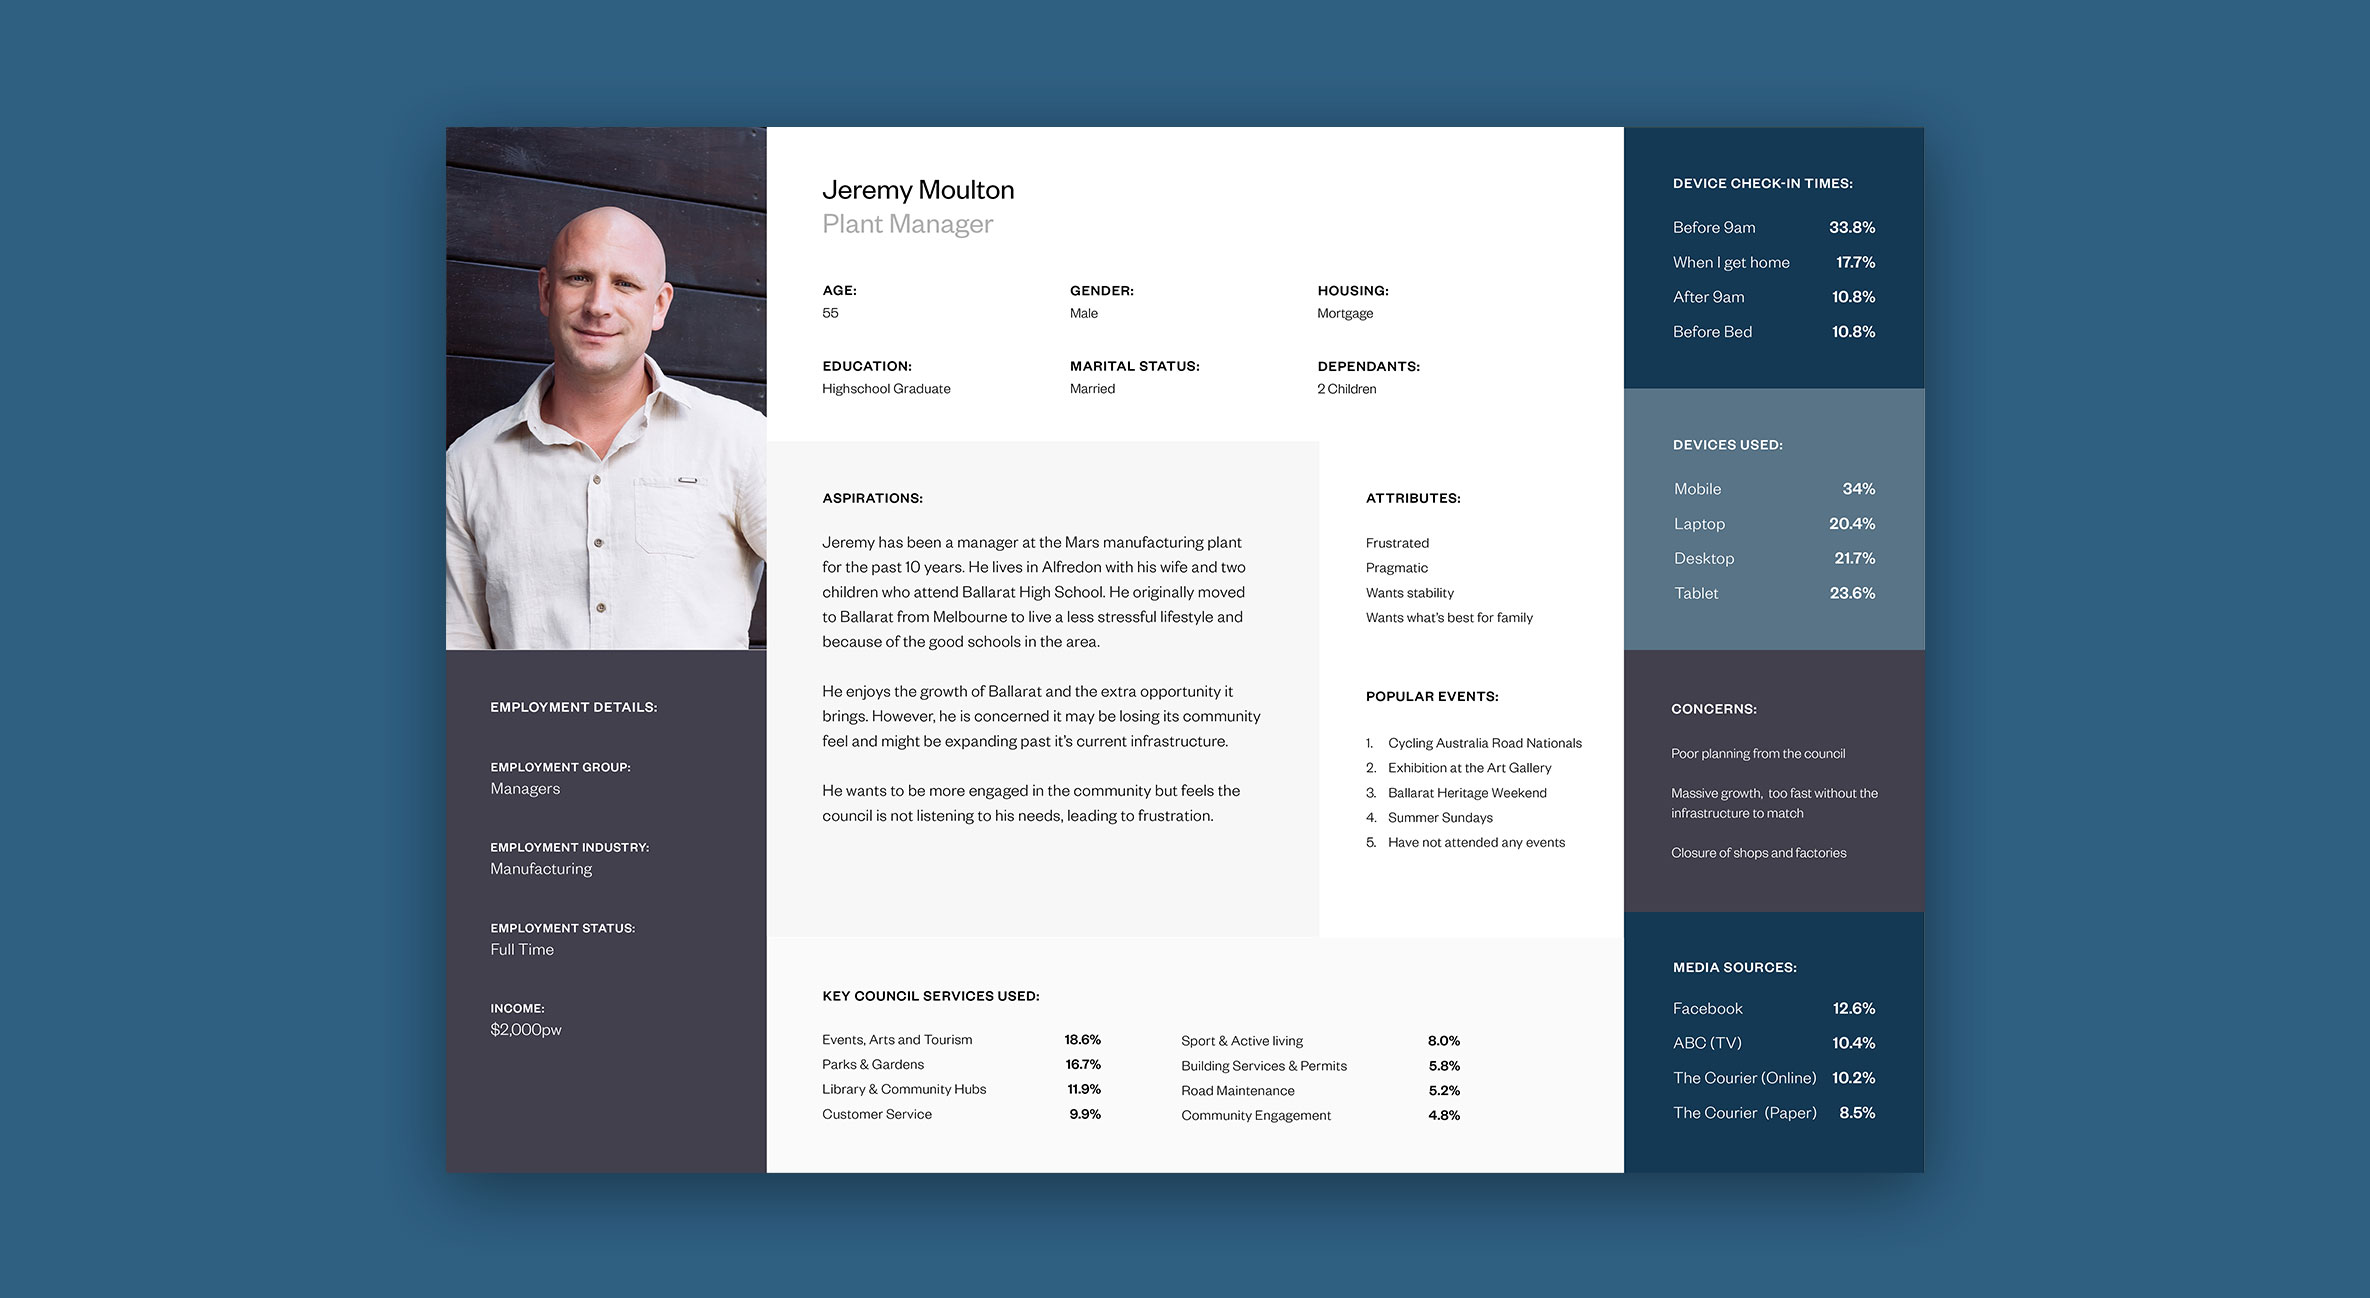
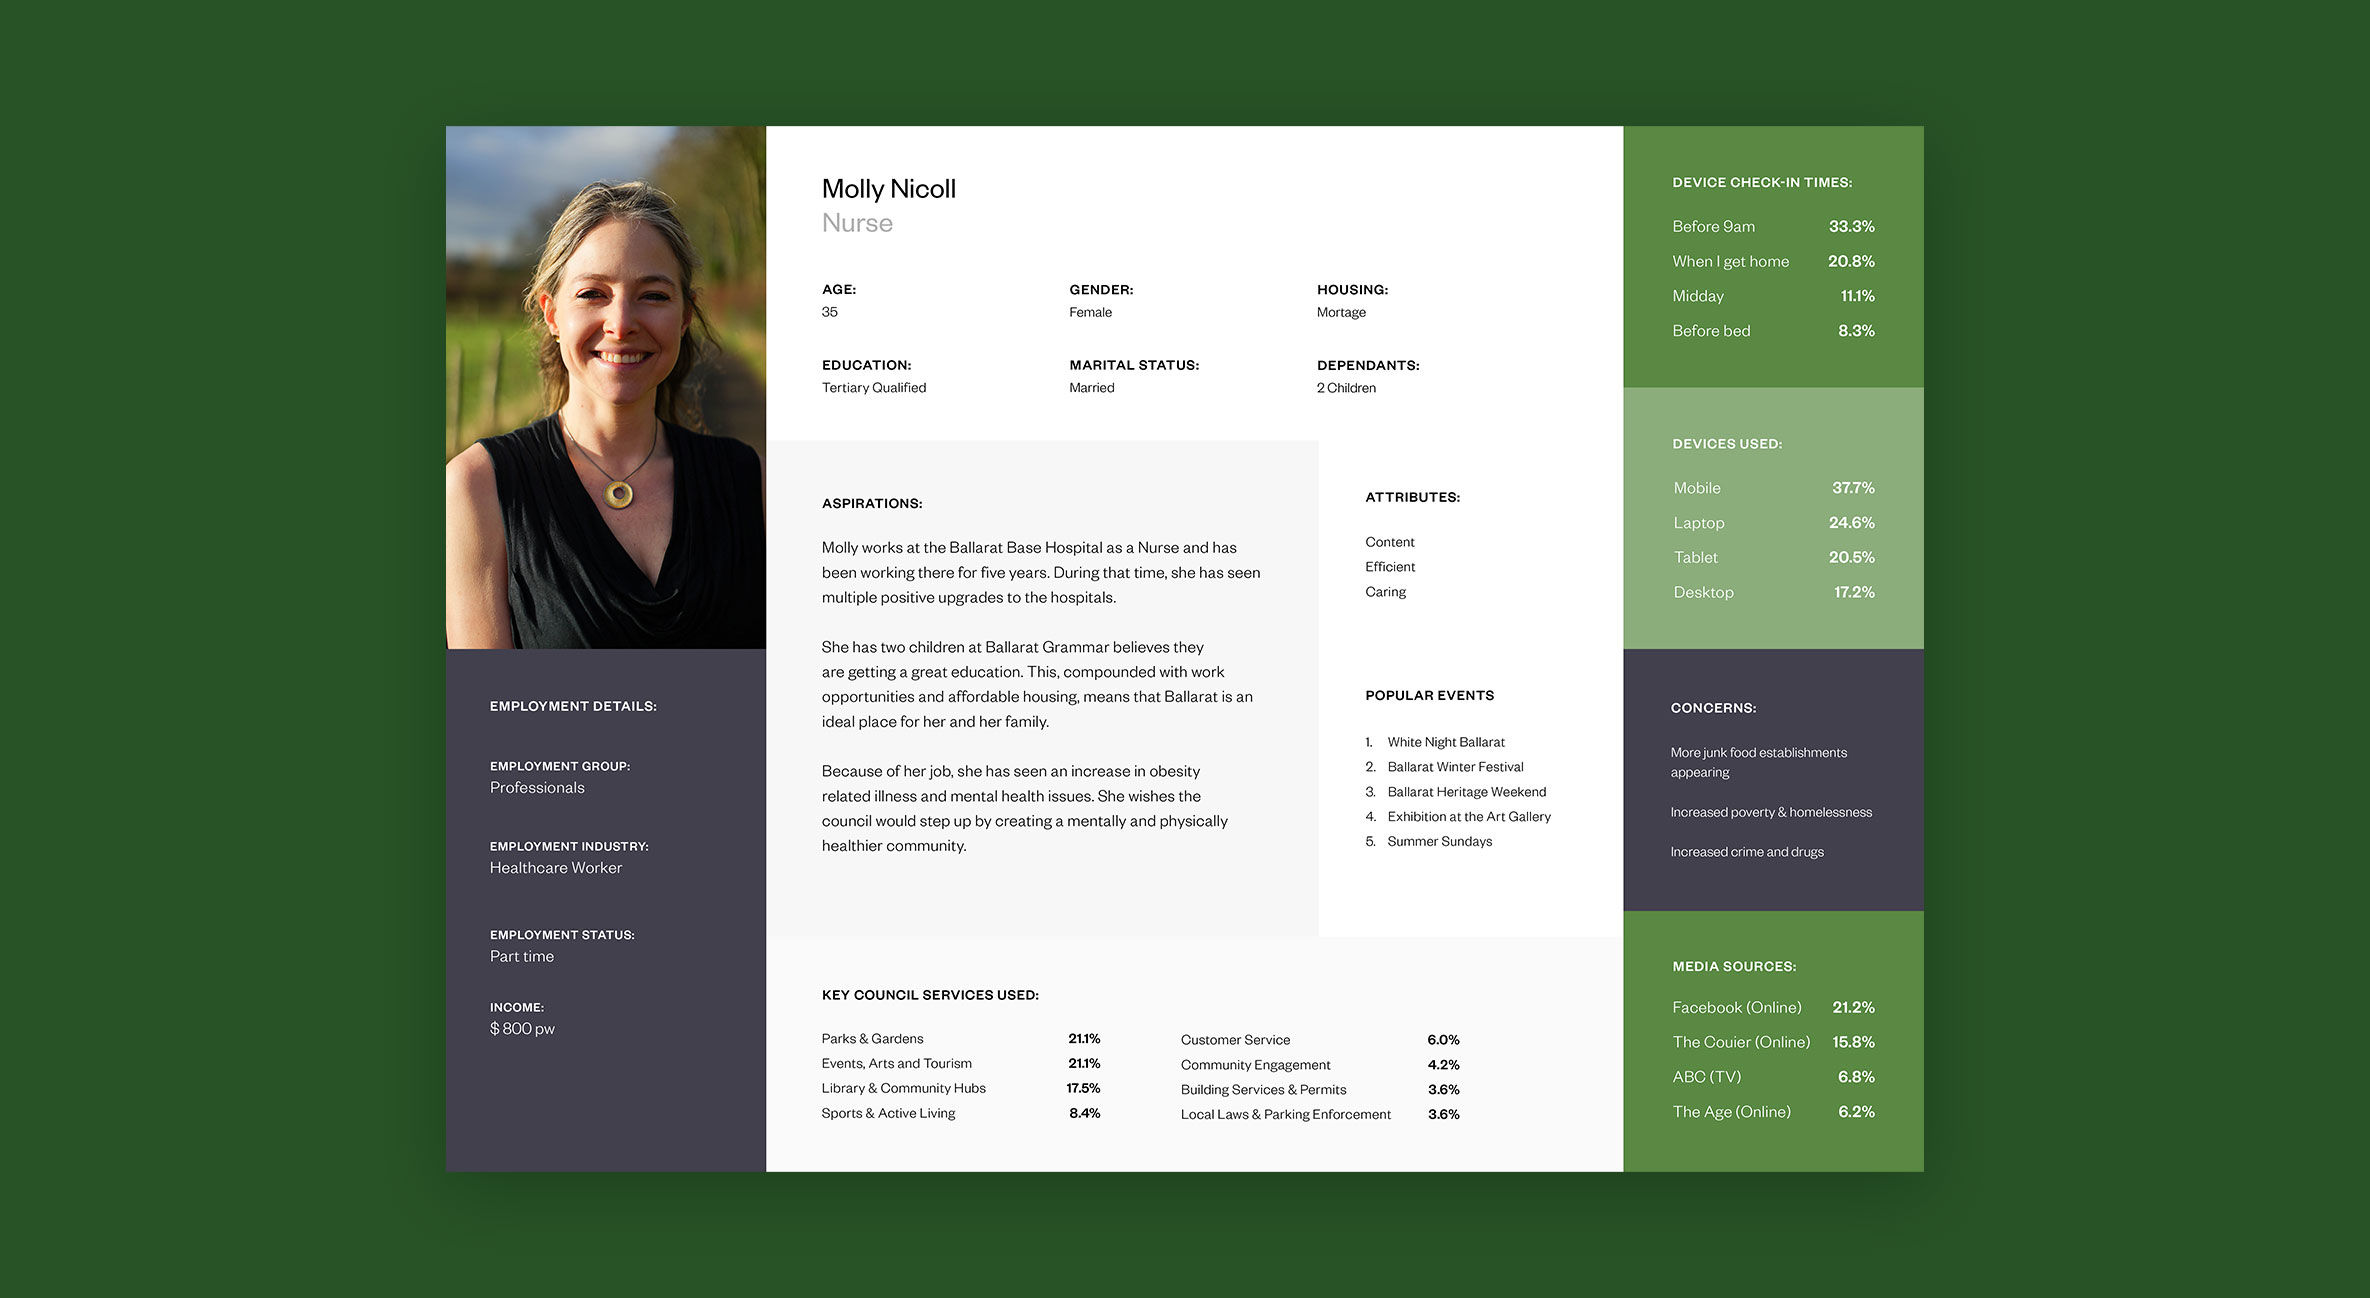
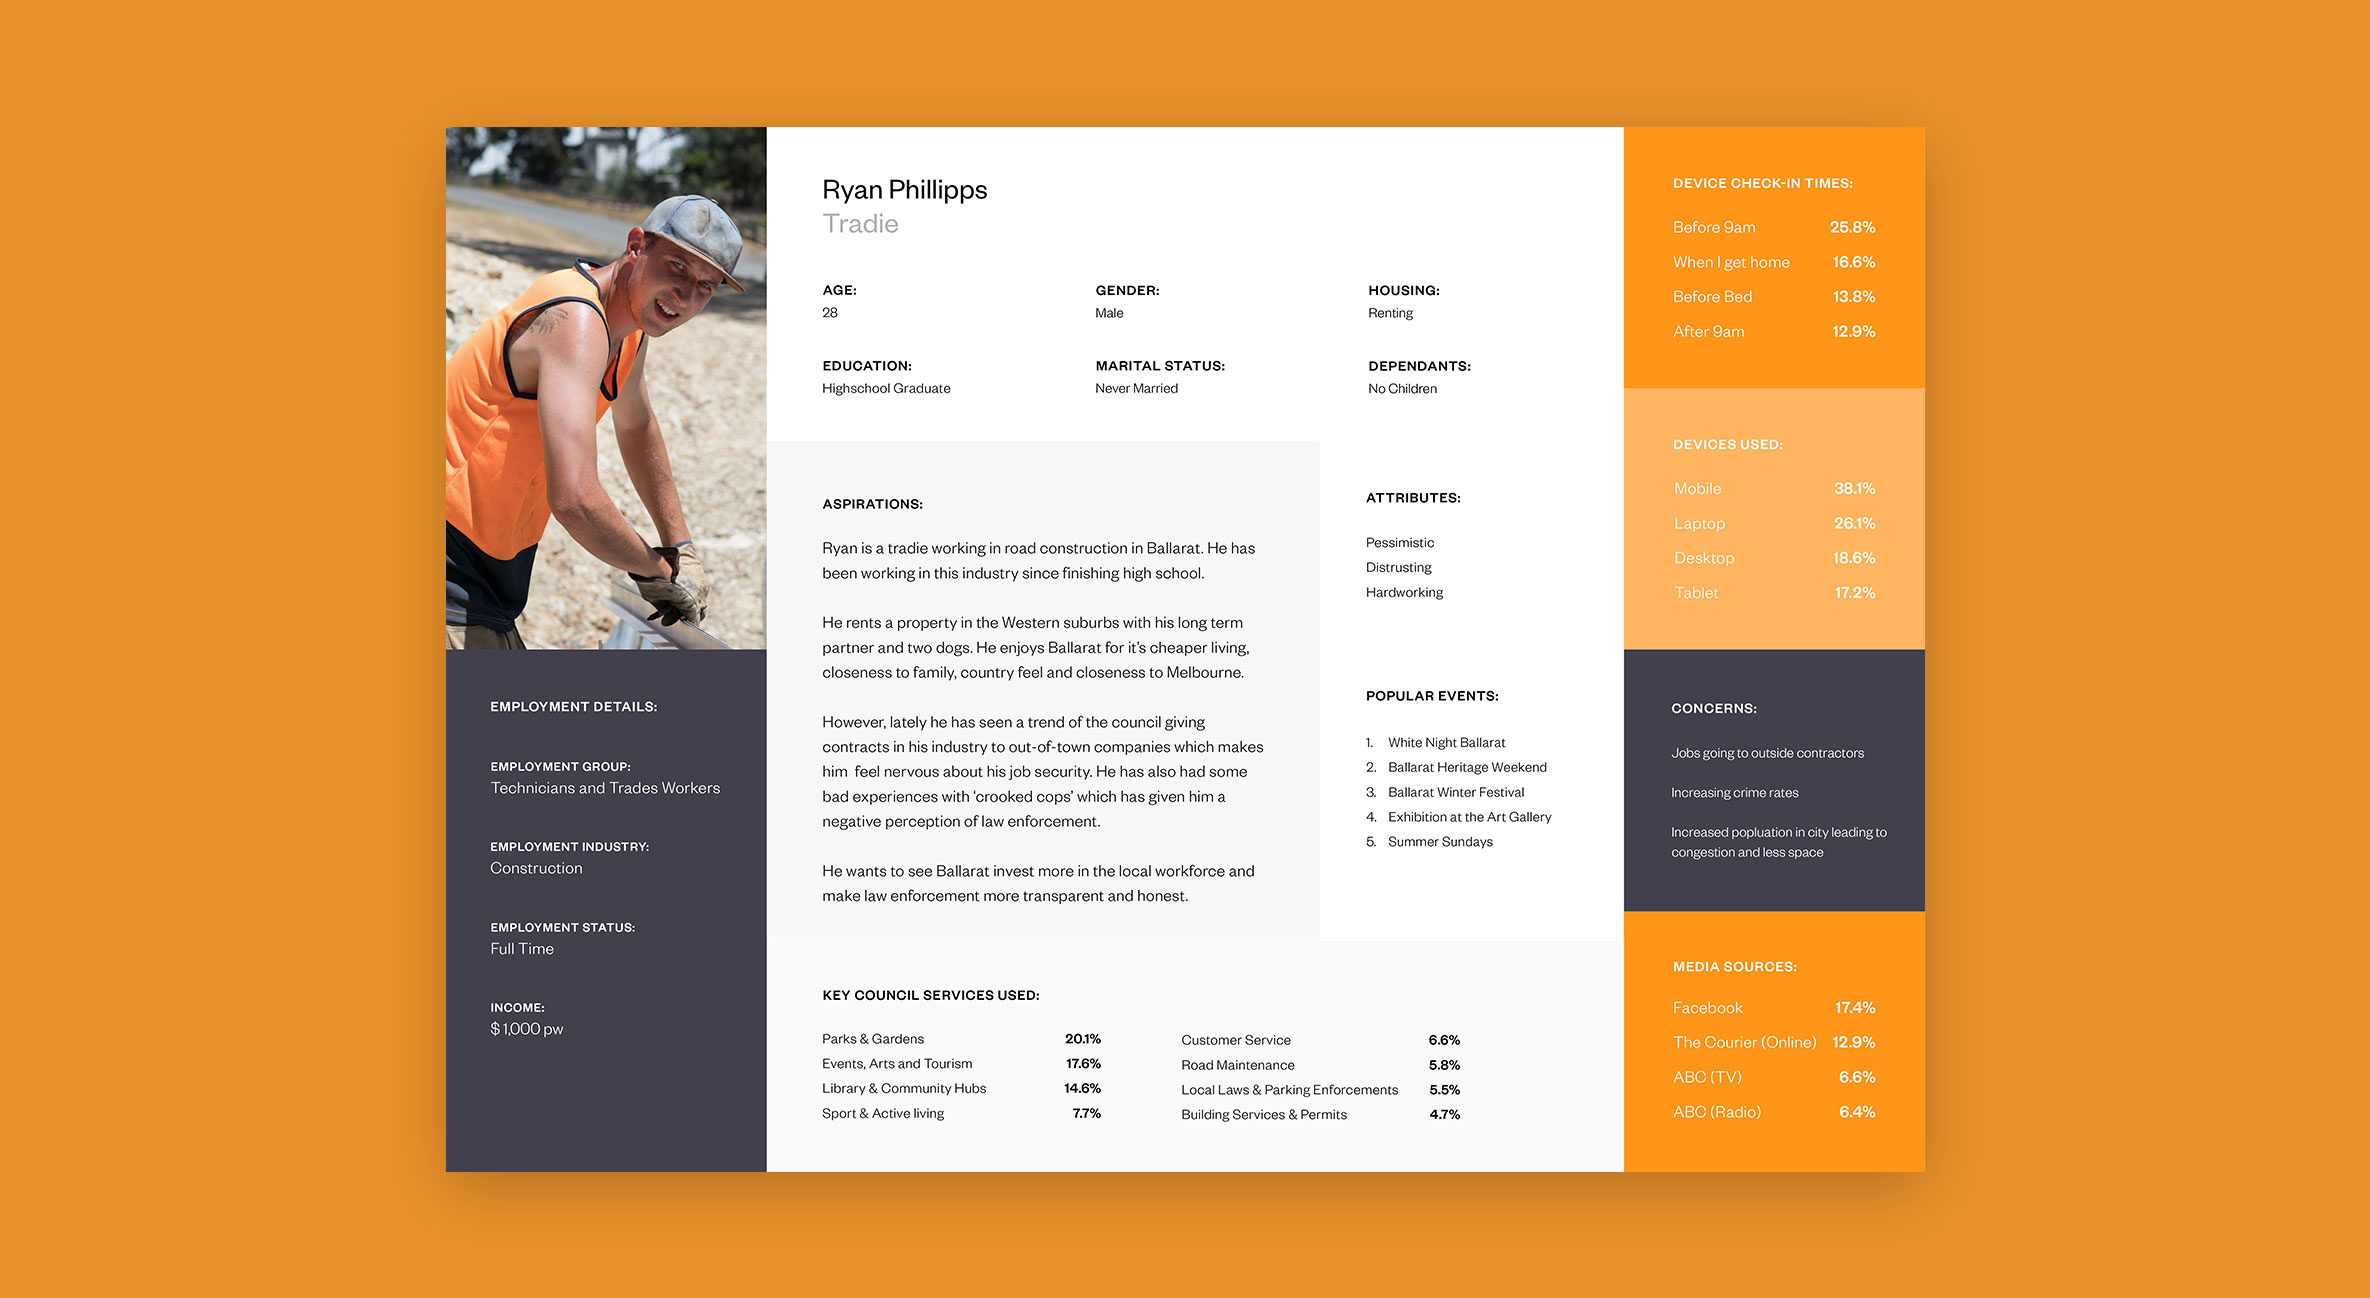
At the end of the exercise, we identified 11 persona archetypes that could be used as the foundation of our user research. Although 11 personas would usually be considered a lot, we felt that the council’s need to cater to all of the community warranted all 11 persona archetypes to fully capture the broad spectrum of people within the population.
